Cursos de Datos e IA
Los mismos datos para todos, vengan de Udemy o de Coursera: precio, valoración, duración e idioma. 470 cursos encontrados. Afinar la búsqueda

Spreadsheet Macros and VBA Automation
Master Excel VBA and Macros to automate repetitive tasks and boost productivity. Learn how to transform manual Excel work into efficient, automated workflows. This course takes you from recording your first macro to writing powerful VBA code for real-world applications. You will explore the VBA object model, learn how to work with ranges, variables, and loops, and apply conditional logic to build dynamic solutions. Through hands-on exercises and practical projects, you will develop the skills to automate data processing, improve reporting efficiency, and create interactive Excel tools using MsgBox and InputBox. Designed for beginners and professionals alike, this course simplifies complex programming concepts into easy-to-follow steps, enabling you to confidently apply VBA in real-world scenarios. By the end of the course, you will be able to automate Excel tasks, write structured VBA code, and significantly enhance your productivity and career opportunities.

Mastering Advanced SQL Queries
This course elevates your SQL capabilities from intermediate to advanced through progressive mastery of sophisticated query techniques and cutting-edge AI optimization methods. Beginning with powerful nested queries and Common Table Expressions, you'll build toward implementing AI-assisted approaches that dramatically enhance query performance and design. Through hands-on labs, interactive dialogues, and challenging assessments, you'll develop the advanced SQL toolkit needed for complex data analysis in modern enterprise environments. Upon completion, you'll be able to: • Design and implement sophisticated data retrieval solutions using subqueries, CTEs, and window functions • Leverage generative AI tools to optimize complex SQL queries for improved performance • Refactor inefficient queries into more elegant, maintainable solutions using advanced SQL patterns • Apply both traditional and AI-enhanced optimization techniques to solve complex data challenges
Jasper AI: Writing a Product Review Blog Post
Enhance your digital content creation skills with this focused two-hour project-based course, where you'll use Jasper AI to create a professional-grade product review blog post for a pair of wireless noise cancelling earbuds. We'll begin by researching some technical specifications about the product while utilizing Jasper AI to generate a captivating title. Then we'll proceed going through the process of developing an outline and an engaging introduction. Lastly, we'll expand on the product's features in detail with the help of Jasper AI's features to complete your blog post and incorporate customer feedback to add depth to your review. By the end of this project you’ll have a well-structured, persuasive product review, showcasing your ability to produce high-quality content with Jasper AI. Note: This course works best for learners who are based in the North America region. We’re currently working on providing the same experience in other regions.
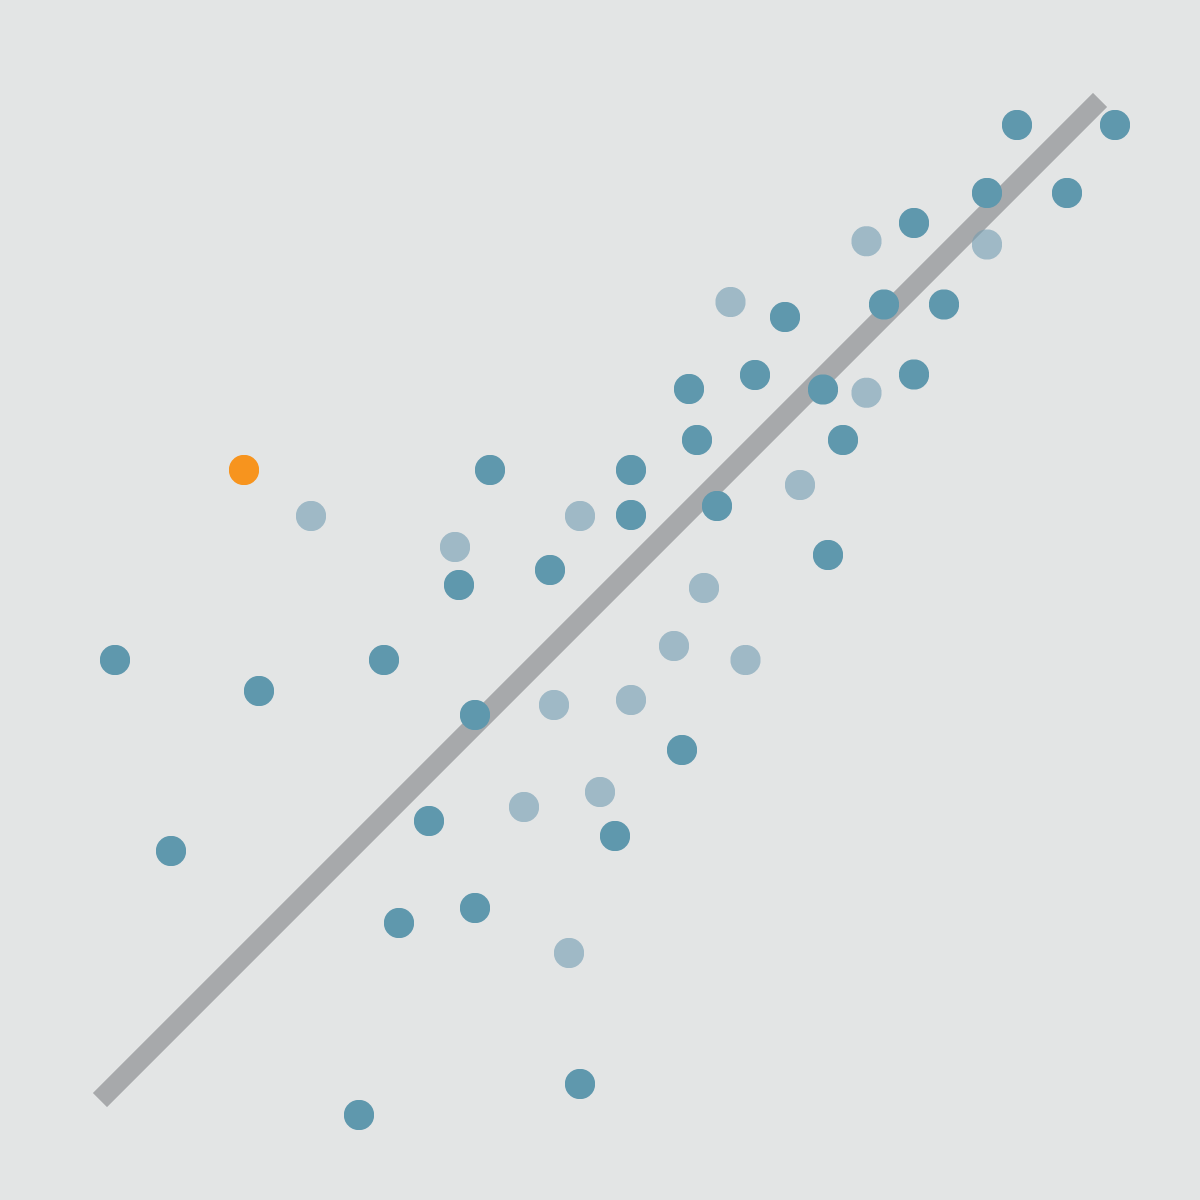
Linear Regression and Modeling
This course introduces simple and multiple linear regression models. These models allow you to assess the relationship between variables in a data set and a continuous response variable. Is there a relationship between the physical attractiveness of a professor and their student evaluation scores? Can we predict the test score for a child based on certain characteristics of his or her mother? In this course, you will learn the fundamental theory behind linear regression and, through data examples, learn to fit, examine, and utilize regression models to examine relationships between multiple variables, using the free statistical software R and RStudio.

Harnessing Open Source LLMs and ChatGPT with Minimal Code
This course offers a comprehensive guide to working with local large language models and ChatGPT, designed for technical professionals who want to explore these powerful tools without diving deep into coding. You’ll begin with the basics, including downloading necessary software, setting up local models, and interacting with them using a no-code approach. By the end of this section, you'll be proficient in managing and running LLMs locally, even if you’re new to the field. As you advance, you’ll delve into more sophisticated techniques, such as streaming responses from local models and leveraging the OpenAI API. You’ll learn to set up your environment, handle API calls, and use Python to integrate different functionalities. Each module is crafted to build your skills progressively, ensuring you gain both practical experience and conceptual understanding of these technologies. The final part of the course covers advanced integrations and function calling with ChatGPT, offering insights into the latest features and capabilities. You’ll explore various approaches to deploying models locally and on the web, using Python with minimal code. This course empowers you to harness the full potential of LLMs and ChatGPT for your projects, making advanced AI accessible and manageable for all skill levels. This course is designed for developers, data scientists, and AI enthusiasts who want to leverage large language models and ChatGPT without extensive programming. Basic familiarity with Python is beneficial but not required, as the course starts with foundational topics and gradually introduces more advanced concepts.

Generative AI for NLP with PyTorch Capstone Project
Get ready to put your Generative AI, Natural Language Processing (NLP), and PyTorch skills into action in this hands-on capstone project from IBM. During this course, you’ll solve a real-world text classification challenge by building an end-to-end NLP workflow, from raw text processing to model evaluation. You’ll design and implement complete pipelines, including text preprocessing, tokenization, vocabulary creation, and dataset preparation using PyTorch Dataset and DataLoader. You’ll train and compare RNN, LSTM, and Transformer models, and explore how each architecture processes language differently. Plus, you’ll fine-tune pretrained models using Hugging Face Transformers, applying techniques used in production-grade AI systems. By the end of the course, you’ll have a portfolio-worthy capstone project that showcases your ability to build, optimize, and evaluate NLP models using metrics such as accuracy and F1-score. Great for talking about in interviews. Enroll today to strengthen your Generative AI and NLP skills and showcase your expertise with this powerful, job-oriented capstone project.

Cómo manejar datos faltantes
En este curso, se tratarán los pasos que se deben seguir para ponderar encuestas de muestra. Se incluirán los métodos para ajustar las no respuestas y para usar datos externos a la encuesta para calibrarla. Entre las técnicas que se abordarán, se encuentran los ajustes que se utilizan para las propensiones de respuesta estimada, la postestratificación, el rastrillado y la estimación de regresión general. Asimismo, se discutirán las técnicas alternativas para imputar los valores de los elementos faltantes. Se tratarán las funciones que ofrecen los diferentes paquetes de software estadístico R®, Stata® y SAS® para la ponderación y la imputación.

NumPy & Pandas: Analyze & Manage Retail Data
Build practical numerical computing and retail data analysis skills with NumPy and Pandas. Designed for aspiring data analysts, business intelligence professionals, and Python enthusiasts, this hands-on course guides you from NumPy foundations to advanced Pandas techniques through case studies and retail datasets. You’ll learn to create and manipulate NumPy arrays using slicing, reshaping, stacking, and broadcasting; apply linear algebra operations and implement gradient descent for analytical problems. You’ll then use Pandas to import data from multiple sources, clean and transform retail datasets, convert data types, filter and sort records, and merge or concatenate data for comprehensive analysis. As you progress, you’ll construct groupby aggregations and pivot tables to assess retail performance, manipulate string fields, parse datetime data for time-based insights, encode categorical data, reshape datasets, and export finalized results for business reporting and decision-making. The course’s distinctive two-in-one structure connects efficient numerical analysis in NumPy with business-ready data management in Pandas. This practical progression helps you develop both technical depth and the ability to prepare and analyze retail data in professional settings.

First Steps in Python with Jupyter Notebooks
In this course, you'll set up a powerful development environment, master essential Python syntax, and learn to leverage GitHub for seamless collaboration. By the module's end, you'll be equipped with the same foundational skills used by industry pros, including cutting-edge GenAI applications. Get ready to transform from a coding novice to a confident data explorer. Upon completion, you'll be able to: • Explain the role of Python in data science and how GitHub integrates into a modern data workflow. • Describe Python’s core syntax, data types, control structures, and functions. • Set up and navigate Jupyter Notebooks as an interactive development environment. • Implement basic version control workflows using Git repositories, commits, and branches for data science projects. • Apply collaborative Git practices through clear commit messages and branching strategies. • Demonstrate the ability to set up a notebook environment and perform initial version control tasks through a challenge lab.

Python: Logistic Regression & Supervised ML
Build a strong foundation in supervised machine learning by learning how to develop, evaluate, and interpret classification models using Python. In this hands-on course, you will work with the real-world Titanic dataset to explore the complete machine learning workflow, from project setup and data preparation to model evaluation and deployment readiness. You will begin by understanding the lifecycle of a supervised machine learning project, defining problem objectives, and using essential Python libraries such as NumPy and pandas. You will also explore core supervised learning algorithms, including Decision Trees and Logistic Regression, to understand how classification models are developed. Next, you will apply exploratory data analysis (EDA), clean and prepare datasets, perform feature engineering, and visualize data using Python libraries. You will then build and evaluate models by splitting datasets, interpreting confusion matrices, and applying cross-validation techniques to improve model reliability and generalization. This course is ideal for learners who want practical experience applying supervised machine learning techniques with Python. By the end of the course, you will be able to prepare data, build supervised learning models, evaluate their performance, and confidently interpret results using a structured machine learning pipeline.
Managing Big Data with MySQL
This course is an introduction to how to use relational databases in business analysis. You will learn how relational databases work, and how to use entity-relationship diagrams to display the structure of the data held within them. This knowledge will help you understand how data needs to be collected in business contexts, and help you identify features you want to consider if you are involved in implementing new data collection efforts. You will also learn how to execute the most useful query and table aggregation statements for business analysts, and practice using them with real databases. No more waiting 48 hours for someone else in the company to provide data to you – you will be able to get the data by yourself! By the end of this course, you will have a clear understanding of how relational databases work, and have a portfolio of queries you can show potential employers. Businesses are collecting increasing amounts of information with the hope that data will yield novel insights into how to improve businesses. Analysts that understand how to access this data – this means you! – will have a strong competitive advantage in this data-smitten business world.

Decode Rasters with Rasterio
Decode Rasters with Rasterio is a practical, concept-driven course for learners who want to work confidently with raster data using Python. Instead of treating rasters as images or black-box files, the course focuses on understanding rasters as structured spatial data—grids of numeric values whose meaning depends on metadata, alignment, and context. Learners begin by building a clear mental model of raster structure, including pixels, grids, bands, and data types. They then examine how raster metadata—such as dimensions, coordinate reference systems, transforms, and bounds—controls how raster data is interpreted and combined. Using Rasterio and NumPy, learners practice inspecting raster files, validating spatial alignment, clipping rasters to areas of interest, and stacking multiple bands in preparation for analysis. The course emphasizes reasoning and judgment, not just execution. Learners develop habits that prevent silent errors, support reproducible workflows, and ensure raster outputs are meaningful and trustworthy for real-world geospatial analysis.

Data Visualization with Tableau and Microsoft Excel
Leverage modern data visualization tools in this comprehensive course designed for business professionals and analysts. Through hands-on projects using real-world datasets, you'll learn to create compelling visualizations and interactive dashboards using industry-standard tools like Tableau and Excel, enhanced by AI-driven insights. This course is perfect for analysts and business professionals who want to transform complex data into clear, actionable insights. Starting with fundamental visualization principles and progressing to advanced dashboard creation, you'll develop the practical skills needed to communicate data stories effectively across any organization. Upon completion, you'll be able to: • Create powerful visualizations and interactive dashboards using Tableau and Excel • Design and implement custom calculations and metrics for deeper analysis • Build compelling data stories through narrative visualization techniques • Optimize dashboard performance and implement real-time updates • Leverage AI tools to enhance visualization design and automation
Regression Analysis Fundamentals
By the end of this course, you'll be able to run a regression analysis in Excel, SPSS, and R, interpret the results with confidence, and turn them into a story that drives real decisions. You'll uncover the relationships hidden in your data, choose the right type of regression for any question, check whether your model can be trusted, and separate genuine cause from mere coincidence. Data can feel overwhelming: the patterns hide, and it's hard to tell what's real from what's just chance. This course changes that. Guided by a senior data scientist who specializes in turning numbers into stories anyone can understand, you'll move step by step from the fundamentals of ordinary least squares to diagnosing model assumptions, handling outliers, and avoiding the most common analytical mistakes. What makes this course different is its focus on communication as much as calculation. Running the model is only half the job; the real skill is explaining what it means. You'll build clean charts, translate coefficients into dollars and decisions, and present findings that stakeholders actually remember. Whether you're a beginner or brushing up, you'll leave able to make your data talk.

Intro to Null Hypothesis Significance Testing with z-test
This is primarily aimed at first- and second-year undergraduates interested in psychology, data analysis, and quantitative research methods along with high school students and professionals with similar interests. This course delves into the foundational concepts of probability and statistics, emphasizing the importance of random sampling and the normal distribution. Students will learn to apply statistical methods, including z-scores, effect size, and confidence intervals in the context of null hypothesis significance testing. The course also covers the implications of the central limit theorem and the relationship between statistical power and error types. Table of Contents: Probability and Distributions The Normal Distribution Sampling Distributions and the Central Limit Theorem The Logic of Null Hypothesis Significance Testing Null Hypothesis Significance Testing With the z-test Errors in Null Hypothesis Significance Testing Evaluating Statistical Significance Effect Size, Confidence Intervals, and Power

Data Science Project Capstone: Predicting Bicycle Rental
This course is the seventh of eight. In this project, we will tackle a prediction problem: forecasting the number of bicycles that will be rented on a given day. Using historical data, we will consider factors such as weather conditions, the day of the week, and other relevant variables to accurately predict daily bicycle rentals. This will help ensure that our bicycle rental service is prepared with the appropriate number of bicycles each day. We will learn specifically about data acquisition and correlation.

Deep Neural Network for Beginners Using Python
Updated in May 2025. This course now features Coursera Coach! A smarter way to learn with interactive, real-time conversations that help you test your knowledge, challenge assumptions, and deepen your understanding as you progress through the course. Are you ready to become a deep learning expert? This step-by-step course guides you from basic to advanced levels in deep learning using Python, the hottest language for machine learning. Each tutorial builds on previous knowledge and assigns tasks solved in the next video. You will: - Learn to train machines to predict like humans by mastering data preprocessing, general machine learning concepts, and deep neural networks (DNNs). - Cover the architecture of neural networks, the Gradient Descent algorithm, and implementing DNNs using NumPy and Python. - Understand DNN methodologies with real-world datasets, such as the IRIS dataset. Designed for those interested in data science or advancing their skills in DNNs, this course requires a background in deep learning and a basic understanding of Python and mathematics will be helpful. It’s clear and beginner-friendly, teaching theoretical concepts followed by practical implementation.

Alteryx Advanced
Updated in May 2025. This course now features Coursera Coach! A smarter way to learn with interactive, real-time conversations that help you test your knowledge, challenge assumptions, and deepen your understanding as you progress through the course. Dive into advanced data analytics with our Alteryx course: - Begin by mastering data cleansing, handling multiple files, sampling, and regex for parsing XML. - Enhance your skills with in-database processing, blending, and selecting data efficiently. - Advance to app and macro customization, creating batch macros, and handling errors with conditional logic. - Learn Alteryx's machine learning capabilities, from building models to deploying them for fraud detection and customer segmentation. Designed for data professionals with basic Alteryx knowledge, the course offers hands-on exercises and real-world examples. The end goal is to transform complex data challenges into actionable insights, enabling you to drive informed business decisions.
Data Visualization and Reporting
In Data Visualization and Reporting, you’ll learn to turn raw data into clear charts, dashboards, and reports that people actually use. This course is organized around workplace skills and job tasks, mirroring responsibilities you’ll see in real job descriptions. Start by checking what you already know, then focus on the areas you want to strengthen. If you’re confident, skip ahead. If a topic is new, review targeted lessons curated from multiple expert instructors. You’ll practice choosing the right chart for an analytical purpose, applying visual design for clarity and impact, and building visuals in Tableau and Excel. Then you’ll assemble them into readable dashboards and reports, format layouts for consistency, and add titles and annotations that surface the “so what.” Each module culminates in a graded, job-task assessment to help you validate progress. By the end, you’ll be ready to perform common tasks in roles like Data Analyst, Business Intelligence Analyst, Reporting Analyst, Operations Analyst, or Dashboard Developer.

Python for Data Analysis: Step-By-Step with Projects
This course features Coursera Coach! A smarter way to learn with interactive, real-time conversations that help you test your knowledge, challenge assumptions, and deepen your understanding as you progress through the course. In this hands-on course, you will learn how to use Python for data analysis through practical, step-by-step projects. You will start with Python basics, including data types, functions, and loops, and then dive into the powerful Pandas library to load, manipulate, and clean data. As you explore data, you'll master techniques like combining datasets, renaming columns, sorting data, and cleaning text. The course then covers exploratory data analysis (EDA) using statistical methods and the Seaborn library to visualize and interpret relationships between variables. You’ll also gain experience working with time series data, learning how to resample data, handle time-based analysis, and apply rolling windows. Throughout the course, you’ll apply your skills to real-world datasets, including NBA games, Czech bank data, and Olympic Games data, providing valuable project experience. The course will also guide you in addressing common challenges in data analysis, such as handling missing data and outliers. This course is perfect for beginners interested in data analysis or anyone looking to gain practical experience in using Python for data science. While no prior experience is required, familiarity with basic programming concepts is helpful. By the end of the course, you will be able to clean and transform data, perform exploratory data analysis, and visualize relationships within datasets, all while working with real-world data projects.

AWS Elastic Beanstalk & CI/CD for Cloud Projects
Build practical cloud deployment and DevOps skills with AWS Elastic Beanstalk and CI/CD. You’ll begin by configuring a development environment and build files, then use Git and AWS CodeCommit for version control. You’ll automate reliable deployments with AWS CodePipeline and configure notifications to support a complete CI/CD workflow. Next, you’ll explore the core AWS Elastic Beanstalk workflow and learn to create, configure, deploy, and manage applications through its simplified PaaS framework. You’ll also apply deployment strategies, customize scaling, set policies, and integrate databases for persistent application data. Finally, you’ll connect these skills through a project-driven case study focused on flight monitoring during the COVID-19 pandemic. You’ll deploy an application that uses APIs, pie chart visualization, and filters to generate actionable insights. Designed for learners seeking foundational knowledge and hands-on experience in cloud deployment, this course uniquely combines guided implementation with an end-to-end case study. Enroll to confidently design, test, automate, deploy, and scale cloud applications using AWS Elastic Beanstalk, Git, CodeCommit, and CodePipeline.
Transform, Analyze, and Report Data with R
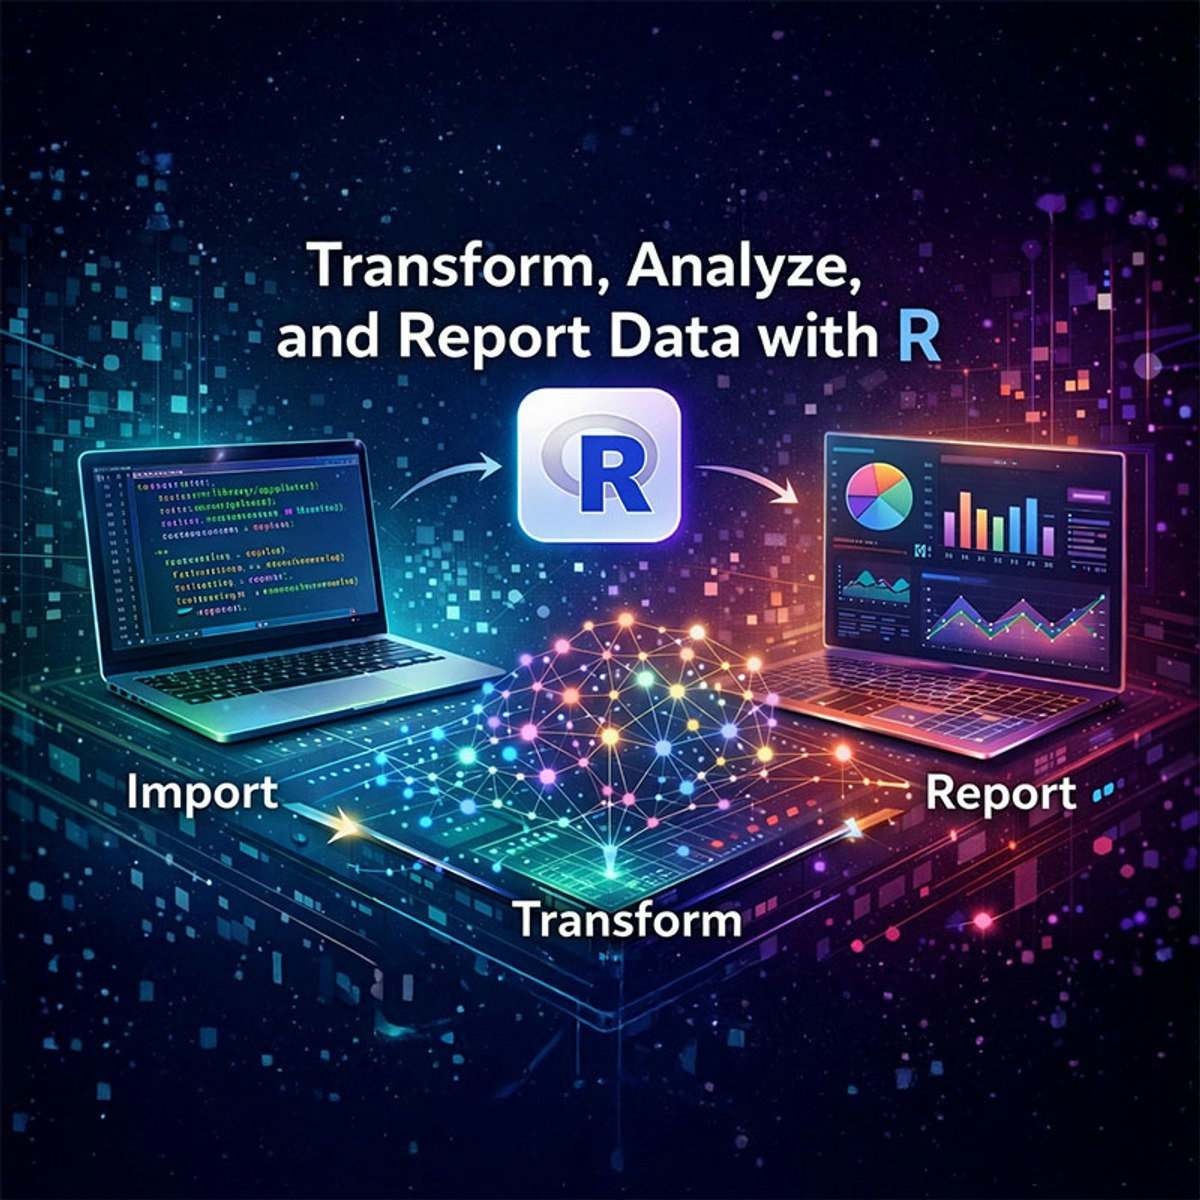
This beginner-level course is your entry into the world of robust, scalable data analysis with R. Designed for aspiring analysts, you will learn to build sophisticated, end-to-end projects from the ground up. You'll master the "Tidyverse" approach, using dplyr to write clean, pipe-based workflows that merge, filter, and prepare complex raw data for analysis. You will also master automation—the hallmark of a modern analyst. Using R Markdown and knitr, you'll transform static scripts into dynamic reports that automatically update visualizations with new data. Finally, you'll dive into data science by rigorously evaluating predictive models with diagnostic tools such as ROC curves and cross-validation. Through hands-on learnings, you'll leave with a portfolio-ready project and the ability to build efficient, reproducible workflows. No prior R experience is necessary.

Statistical Thinking & Predictive Modeling
Build the analytical skills that turn raw data into decisions leaders can act on. In this course, you will move through a complete decision-intelligence workflow — from exploring and summarizing data to running rigorous statistical tests, building production-ready predictive models, and communicating results to non-technical stakeholders. You will learn to generate descriptive statistics and visual summaries that reveal data quality issues before they distort your analysis. You will design and execute hypothesis tests, interpret p-values in business terms, and balance Type I and Type II error trade-offs with confidence. In the modeling track, you will build and cross-validate classification models using scikit-learn, handle class imbalance with techniques like SMOTE and class weights, and apply feature-selection methods — including RFE and LASSO — to balance accuracy with interpretability. The course culminates in an end-to-end customer lifetime value prediction project that integrates every skill into a portfolio-ready deliverable. Whether you are moving into a data analyst, business intelligence, or machine learning role, this course gives you the technical depth and communication skills to stand out.

Gen AI Dev- Foundation Model API Integrations
Foundation model (FM) API integrations form the backbone of modern generative AI applications on AWS. When you understand how to implement these integrations effectively, you can build scalable, production-ready applications. These applications can utilize the power of more than 100 serverless FMs supported by Amazon Bedrock and other AWS AI services. In this module, you'll explore the different types of foundation model request patterns, and you'll learn how streaming responses are used to impl

GenAI for Paralegals: Streamlining Legal Drafting
In this course, you will discover how Generative AI is revolutionizing the paralegal profession by enhancing efficiency in legal research, document preparation, and workflow automation. Designed to equip you with both knowledge and hands-on skills, this course will empower you to harness AI for legal research, document automation, and workflow optimization. Through practical applications and real-world case studies, you’ll learn how to integrate AI tools seamlessly into your daily work, boosting efficiency while maintaining accuracy and ethical integrity. This course is designed for paralegals, legal assistants, legal support staff, paralegal students, and law firm administrative professionals who want to enhance their efficiency and stay ahead in the evolving legal industry. Whether you’re looking to streamline routine tasks, improve accuracy in legal research, or integrate AI into your workflow, this course will provide the essential skills needed to leverage Generative AI effectively. While no prior experience with AI is required, learners should have a basic understanding of paralegal duties and legal document preparation. A willingness to engage with new technology and explore AI-driven solutions for legal work will help you maximize the benefits of this course. By the end of this course, you’ll be equipped to integrate Generative AI into your paralegal workflow, streamlining legal research, automating document drafting, and enhancing efficiency while maintaining accuracy and ethical integrity. With AI reshaping the legal field, your ability to leverage these tools will set you apart as a skilled and forward-thinking professional. Now, it’s time to apply your new skills and embrace the future of AI-powered legal support!
Python for Data Visualization - A Beginner's Guide
This course features Coursera Coach! A smarter way to learn with interactive, real-time conversations that help you test your knowledge, challenge assumptions, and deepen your understanding as you progress through the course. In this course, you'll learn how to effectively use Python for data visualization. You will start by setting up your environment and installing key libraries like Anaconda, Matplotlib, Seaborn, and Cufflinks, which are the cornerstone tools for data visualization in Python. You'll explore reading and processing data with Pandas, setting the stage for building powerful visuals. As the course progresses, you’ll dive deeper into creating different types of plots, including line plots, histograms, bar charts, scatter plots, and time-series visualizations. You'll master various customization techniques to modify colors, labels, axes, and styles to enhance the clarity and impact of your visualizations. You’ll also learn to manage multiple plots in a single figure, use Seaborn for aesthetic charts, and get hands-on with Plotly and Cufflinks for interactive, 3D visualizations. The course is perfect for beginners with no prior experience in Python or data visualization. It is designed for anyone interested in leveraging Python to present data in engaging, meaningful ways. By the end of the course, you will be able to confidently create visualizations using Matplotlib, Seaborn, and Plotly. You will also be able to visualize time-series data and manage data visuals in multi-plot layouts, making it ideal for those who want to enhance their data analysis skills. By the end of the course, you will be able to create line, bar, scatter, and 3D plots, visualize time-series data, and manipulate chart aesthetics to communicate complex data insights effectively.
Researcher's guide to RNA sequencing data
This course is a follow up course to "Choosing genomics tools" which dives into further detail about RNA informatics methods! This course is for individuals who: - Have taken Researcher's Guide to Fundamentals of Omic Data - Have RNA data and don’t know what to do with it. - Want a basic overview of their RNA focused data type. - Want to find resources for processing and interpreting RNA data What this course will cover: - Fundamentals of RNA methods. - Resources you may consider looking into for your own purposes. - Questions you should ask yourself and your colleagues about your goals and experimental design. What this course will NOT cover: - Code needed to process your data. - Details about every type of experimental design. - Everything you’d need to know to make you a computational biologist. In other words we still highly encourage you to consult your informatics and computational colleagues, especially those who may have done any handling of data you are trying to learn about.
NLP Modelos y Algoritmos
Este curso te brindará los conocimientos necesarios para la implementación de algoritmos de NLP. Mediante el uso de los últimos algoritmos más populares en NLP se procederá a dar solución a un conjunto de problemas propios del área. Para realizar este curso es necesario contar con conocimientos de programación de nivel básico a medio, deseablemente conocimiento básico del lenguaje Python y es recomendable conocer los Jupyter Notebooks en el entorno Anaconda. Para desarrollar aplicaciones se va a utilizar Python 3.6 o superior. Alternativamente se puede utilizar el entorno de Anaconda con la misma versión de Python. Como editor de código, los ejemplos van a ser editados en el Notebook de Anaconda, pero el alumno puede utilizar cualquier editor de texto que reconozca notebooks de Anaconda. Librerías que es necesario tener instaladas para realizar el curso: NLTK, Scikit-learn, Spacy y TensorFlow.

Validate and Track Data History Confidently
Transform your data engineering expertise with advanced validation and historization techniques that ensure bulletproof data integrity. This course equips you with the critical skills to programmatically verify transformation accuracy through automated checksum validation and build enterprise-grade reusable logic for tracking historical changes in dimensional data. This Short Course was created to help data management and engineering professionals accomplish reliable, auditable data transformations that maintain complete historical accuracy. By completing this course, you'll be able to implement automated data validation workflows that catch discrepancies before they impact downstream systems, and architect modular SCD2 logic that can be deployed across multiple dimensional tables with confidence. By the end of this course, you will be able to: Evaluate data transformation accuracy by comparing aggregate checksums and flagging discrepancies Create reusable transformation logic to track historical changes in dimensional data This course is unique because it combines practical validation techniques with enterprise-scalable historical tracking patterns, focusing on real-world implementation challenges that data engineers face daily. To be successful in this project, you should have a background in advanced SQL, data warehousing concepts, ETL/ELT processes, and experience with dimensional modeling.
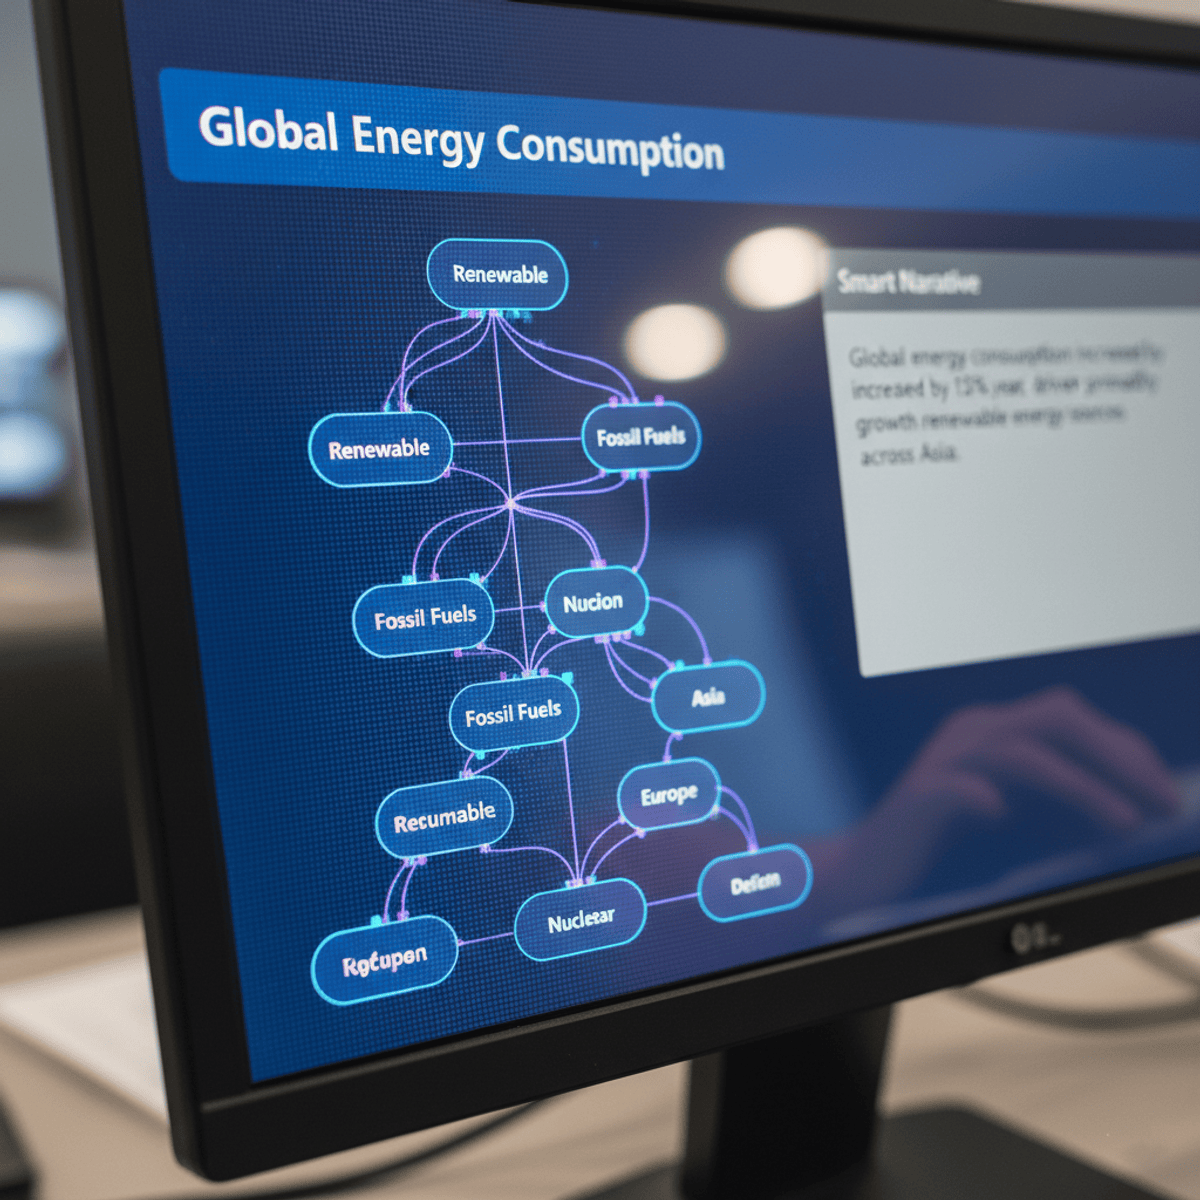
Analyze and Visualize Data Using Power BI
By the end of this course, learners will be able to analyze business data, design interactive reports, apply advanced visualizations, and implement secure, insight-driven Power BI solutions. This Power BI Training course provides a comprehensive, hands-on learning experience that guides learners from foundational concepts to advanced analytics and security features. Learners begin by understanding Power BI’s role in business intelligence, learning how to format data and create clear, effective visualizations. As the course progresses, learners gain practical experience building structured reports, working with real-world datasets such as global energy data, and organizing report views for meaningful data storytelling. What makes this course unique is its strong focus on applied learning through real datasets, AI-powered visuals, and interactive features such as decomposition trees, Q&A, smart narratives, and what-if analysis. Learners also develop essential data modeling skills, including relationships, calculations, and row-level security, ensuring reports are both accurate and secure. By completing this course, learners will be equipped with job-ready Power BI skills that support data-driven decision-making, enhance analytical confidence, and enable them to create professional, business-ready dashboards suitable for real-world organizational use.
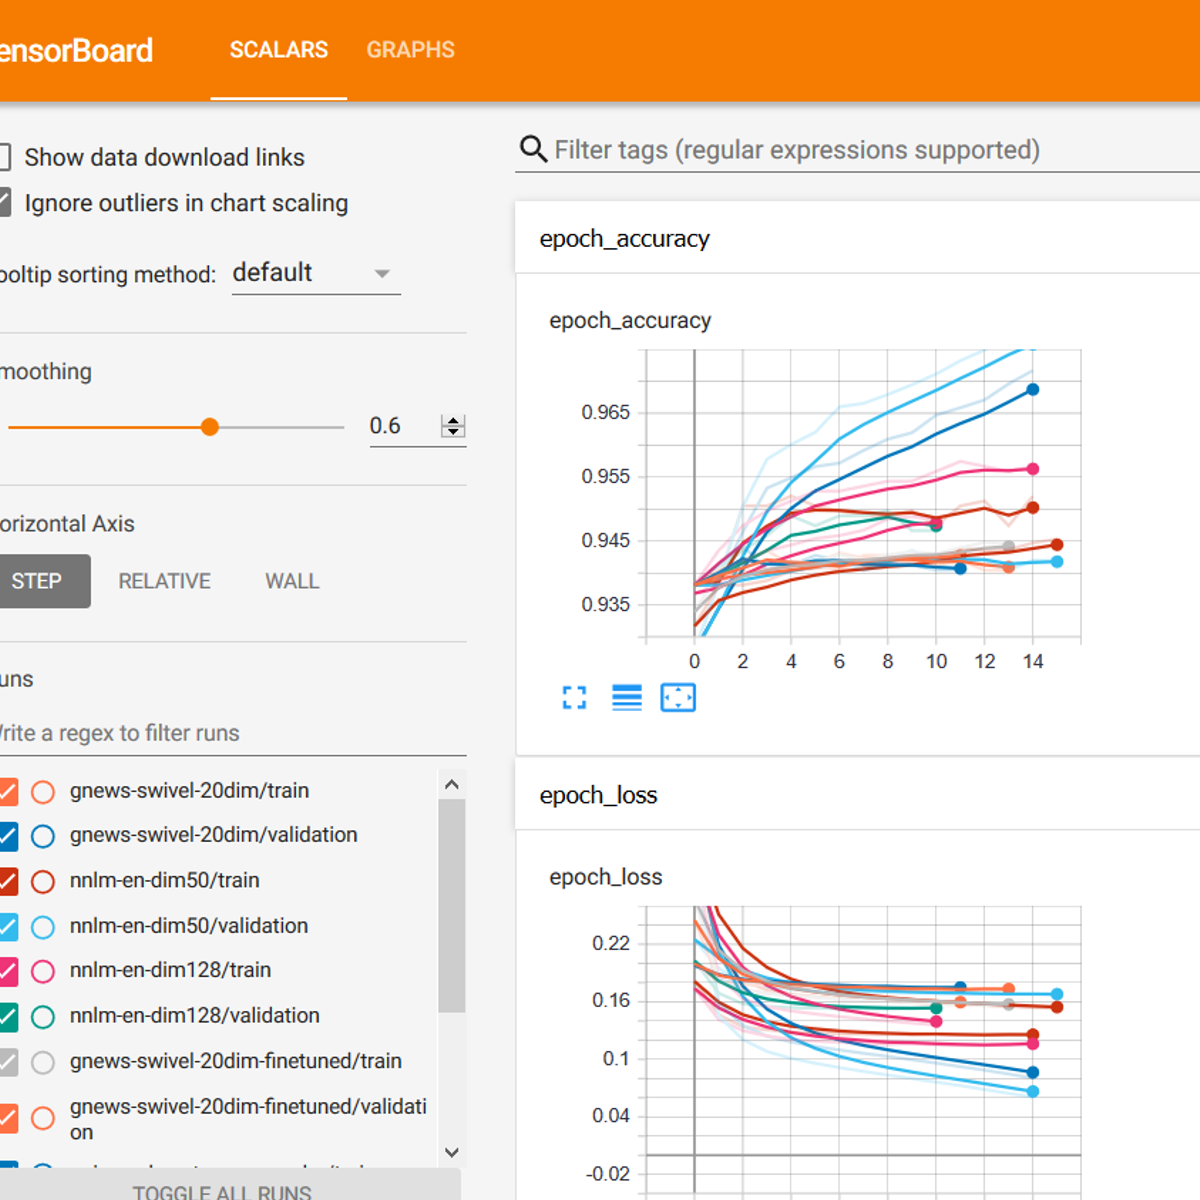
Transfer Learning for NLP with TensorFlow Hub
This is a hands-on project on transfer learning for natural language processing with TensorFlow and TF Hub. By the time you complete this project, you will be able to use pre-trained NLP text embedding models from TensorFlow Hub, perform transfer learning to fine-tune models on real-world data, build and evaluate multiple models for text classification with TensorFlow, and visualize model performance metrics with Tensorboard. Prerequisites: In order to successfully complete this project, you should be competent in the Python programming language, be familiar with deep learning for Natural Language Processing (NLP), and have trained models with TensorFlow or and its Keras API. Note: This course works best for learners who are based in the North America region. We’re currently working on providing the same experience in other regions.

The DMAIC Framework - Define and Measure Phase
The course is designed for Lean Six Sigma professionals to excel in the American Society for Quality (ASQ) Certified Six Sigma Green Belt (CSSGB) exam. The course focuses specifically on the first two phases of the define, measure, analyze, improve, and control (DMAIC) framework. In the define phase, you will learn to define a problem statement and project scope, whereas in the measure phase, you will learn about effective data collection strategies and measurement system analysis (MSA). By the end of this course, you will be able to: - Define specific, measurable, achievable, relevant, and time-bound (SMART) project goals and objectives. - Analyze the voice of the customer (VOC) data to translate it to critical to quality (CTQ) parameters. - Explain process mapping and define key performance metrics. - Plan data collection activities to quantify the performance of the process. The course is best suited for individuals who analyze and solve quality problems and work on quality improvement projects. It is recommended that you complete the first course in the ASQ-Certified Six Sigma Green Belt Exam Prep Specialization, Overview: Six Sigma and the Organization, before starting this course.

Developing Data Models with LookML 日本語版
このコースを受講すると、スケーラブルでパフォーマンスの高い LookML(Looker モデリング言語)モデルを開発し、ビジネス ユーザーの疑問解決に役立つ標準化されたすぐに使えるデータを提供できるようになります。このコースの修了時には、組織の Looker インスタンスでデータをキュレートして管理するための LookML モデルの構築と維持が可能になります。
Advanced Data Analysis and Visualization with Pandas
This advanced Pandas course delves deep into date-time manipulation, covering Timestamps, DatetimeIndex objects, and pd.date_range for effective time series handling. - You'll master techniques like using the dt attribute and DateOffset objects for arithmetic operations and timedeltas. - Learn essential input-output operations, including exporting DataFrames to CSV and Excel files using openpyxl, and seamless file imports. - Enhance data presentation with Matplotlib for basic visualizations, customizing aesthetics with templates, and creating bar and pie charts. Ideal for data analysts, scientists, and Python enthusiasts with intermediate to advanced Pandas skills, this course enriches data workflows and visualization capabilities.

Using Python With Excel
Excel can be a blessing and a curse. Working with small amounts of data and simple operations? Excel is your go-to tool. However, Excel's limitations show themselves whenever you need to work with large amounts of data and perform the types of complex operations necessary to compile key analytics, and pushing a spreadsheet past its comfort zone usually means slower performance. Enter Python, rapidly becoming one of the world's most popular programming languages. As a powerful tool that can speed up your data operations, Python, in conjunction with Excel, lets you inspect, clean, and filter data, along with the ability to create memorable and dynamic reports that deliver crucial business insights. Through the pandas and openpyxl libraries, you'll load and reshape data, build and format workbooks directly through code, and automate reporting work that used to take hours by hand. Whether it's converting data, creating visually striking graphs and charts, or shaping large amounts of data in any number of useful ways, you'll find a new-found ease and efficiency with Python that would be otherwise unattainable in Excel alone. By the end of this course, you'll combine data from multiple sources and build fully automated, visually polished Excel reports.

Analyze Usage Data
Analyze Usage Data is an intermediate-to-advanced short course designed for IT managers, platform owners, and operations professionals who need to interpret usage data responsibly before acting on it. Rather than treating reports as definitive answers, the course emphasizes thoughtful analysis, trend evaluation, and clear communication. Learners work with realistic Confluence usage reports to understand what common metrics such as page views and popularity actually measure—and what they do not. The course focuses on building judgment: recognizing when numbers are meaningful, when they are misleading, and how context and assumptions shape interpretation. Learners move from interpreting individual usage signals to evaluating trends over time. They practice distinguishing patterns from noise, comparing trends against baselines, and translating evidence into cautious, defensible recommendations suitable for stakeholder and leadership discussions. By the end of the course, learners can extract usage evidence, evaluate trends without overclaiming, and communicate insights that support planning, alignment, and responsible decision-making in real organizational environments.

Fake News Detection with Machine Learning
In this hands-on project, we will train a Bidirectional Neural Network and LSTM based deep learning model to detect fake news from a given news corpus. This project could be practically used by any media company to automatically predict whether the circulating news is fake or not. The process could be done automatically without having humans manually review thousands of news related articles. Note: This course works best for learners who are based in the North America region. We’re currently working on providing the same experience in other regions.

Statistics & Mathematics for Data Science & Data Analytics
Updated in May 2025. This course now features Coursera Coach! A smarter way to learn with interactive, real-time conversations that help you test your knowledge, challenge assumptions, and deepen your understanding as you progress through the course. This course equips you with essential statistical and mathematical tools to become proficient in data science and analytics. You will learn key concepts in descriptive statistics, probability theory, regression analysis, hypothesis testing, and more. By the end of the course, you will have a deep understanding of how statistical methods can be applied to solve real-world data problems and enhance data-driven decision-making. The course begins with an introduction to the basics of descriptive statistics, such as measures of central tendency, dispersion, and the differences between sample and population data. You will then explore distributions, including the normal distribution and Z-scores, and how to apply them in various scenarios. The journey continues with probability theory, where you will tackle concepts like Bayes' theorem, expected value, and the central limit theorem, building a solid foundation for statistical analysis. Next, you will dive into hypothesis testing and learn how to perform tests like t-tests and proportion testing. You will also understand the significance of confidence intervals, the margin of error, and Type I and Type II errors. The regression section teaches you how to predict data values using linear regression, explore correlation coefficients, and analyze model accuracy with metrics such as MSE and RMSE. This course is ideal for aspiring data scientists, analysts, and anyone who wants to use statistics to interpret data. No prior knowledge of statistics is required, though familiarity with basic mathematics will be helpful. The course is structured to be engaging and practical, offering exercises and real-world applications that allow you to practice your skills.
Building Systems with the ChatGPT API
In Building Systems With The ChatGPT API, you will learn how to automate complex workflows using chain calls to a large language model. Unlock new development capabilities and improve your efficiency in this brand new short course. You’ll build: 1. Chains of prompts that interact with the completions of prior prompts. 2. Systems where Python code interacts with both completions and new prompts. 3. A customer service chatbot using all the techniques from this course. You’ll learn how to apply these skills to practical scenarios, including classifying user queries to a chat agent’s response, evaluating user queries for safety, and processing tasks for chain-of-thought, multi-step reasoning. This one-hour course, taught by Isa Fulford (OpenAI) and Andrew Ng (DeepLearning.AI), builds on the lessons taught in the popular ChatGPT Prompt Engineering for Developers, though it is not a prerequisite. Hands-on examples make each concept easy to understand. Built-in Jupyter notebooks allow you to seamlessly experiment with the code and prompts presented in the course.

Foundations of Statistical Analysis with Stata
Gain a solid grounding in statistical reasoning and learn the essentials of data management and regression analysis using Stata. This course introduces core statistical concepts and guides learners through the basics of working with data and performing foundational regression techniques. This course covers the fundamental principles of research and statistics, providing a clear understanding of statistical inference, probability, and objectivity in quantitative research. Learners will become proficient in using Stata for data entry, management, and exploration, and will develop skills in simple and multiple regression analysis. By the end of the course, participants will be able to confidently manage datasets and perform essential statistical analyses using Stata. The course combines clear explanations of statistical concepts with practical demonstrations in Stata, using real-world examples to reinforce learning. Learners progress step-by-step from foundational theory to hands-on application, ensuring both conceptual understanding and practical competence. This course is part one of a three-course Specialization designed to build a complete and cohesive understanding of the subject. While it offers valuable skills on its own, you'll gain the most benefit by progressing through all three courses as a structured learning journey. This course is based on Applied Statistics Using Stata, by Mehmet Mehmetoglu and Tor Georg Jakobsen. Copyright ©2022 by Sage Publications Limited. All rights reserved, including rights for text and data mining and training of artificial technologies or similar technologies. Published by Sage Publications Limited, London. Used by arrangement with Sage Publications Limited.

Web Scraping with Python
In this 2-hour long project-based course, you will learn how to analyze complex HTML structures and identify the relevant data to be extracted using Scrapy and XPath. You will apply the concepts of web scraping, including setting up a Scrapy project, generating spiders, and using XPath queries to extract data from websites that do not provide an API. Additionally, you will evaluate the effectiveness and efficiency of your scraping code, considering factors such as changing webpage structures, scalability, and coding defensively to ensure robustness. The course includes hands-on labs where you will create a spider and parse complex HTML, allowing you to practice and reinforce the concepts learned.

Modeling Data in the Tidyverse
Developing insights about your organization, business, or research project depends on effective modeling and analysis of the data you collect. Building effective models requires understanding the different types of questions you can ask and how to map those questions to your data. Different modeling approaches can be chosen to detect interesting patterns in the data and identify hidden relationships. This course covers the types of questions you can ask of data and the various modeling approaches that you can apply. Topics covered include hypothesis testing, linear regression, nonlinear modeling, and machine learning. With this collection of tools at your disposal, as well as the techniques learned in the other courses in this specialization, you will be able to make key discoveries from your data for improving decision-making throughout your organization. In this specialization we assume familiarity with the R programming language. If you are not yet familiar with R, we suggest you first complete R Programming before returning to complete this course.

Generate Visuals for A/B Testing Success
This course introduces practical, hands-on skills for creating and optimizing campaign visuals using generative AI. You’ll learn how to write effective prompts, refine outputs for brand consistency, and prepare assets for A/B testing. Through guided lessons, you’ll generate image variations, compress them for performance, and upload them to a CMS. By the end, you’ll have a clear, repeatable workflow for producing campaign-ready visuals that capture attention and deliver results.

Regression Models
Linear models, as their name implies, relates an outcome to a set of predictors of interest using linear assumptions. Regression models, a subset of linear models, are the most important statistical analysis tool in a data scientist’s toolkit. This course covers regression analysis, least squares and inference using regression models. Special cases of the regression model, ANOVA and ANCOVA will be covered as well. Analysis of residuals and variability will be investigated. The course will cover modern thinking on model selection and novel uses of regression models including scatterplot smoothing.

Fundamentals of Machine Learning
This course provides a comprehensive introduction to the Fundamentals of Machine Learning, covering both conceptual understanding and practical implementation across modern machine learning workflows. It focuses on building strong core foundations, preparing and evaluating data, applying supervised and unsupervised learning techniques, and implementing scalable machine learning solutions using cloud platforms such as AWS and Azure. Participants will gain hands-on experience in developing, training, evaluating, and optimizing machine learning models, along with exposure to advanced techniques such as GPU-accelerated workflows and MLOps. Real-world use cases, demos, and step-by-step guidance are included to ensure learners can confidently apply machine learning concepts in practical scenarios. By the end of this course, you will be able to learn how to: Understand and explain core machine learning concepts, terminology, and workflows Differentiate between AI, Machine Learning, and Deep Learning Prepare, preprocess, and evaluate data for machine learning models Build and evaluate supervised learning models for classification and regression problems Apply unsupervised learning techniques for clustering and pattern discovery Optimize models using cross-validation, hyperparameter tuning, and performance metrics Leverage GPU-accelerated workflows for large-scale machine learning tasks Design and implement machine learning solutions on AWS Build, manage, and operationalize ML workflows using Azure Machine Learning and MLOps best practices This course facilitates learners with approximately 6:30–7:00 hours of video lectures, delivering a balanced mix of theory and hands-on demonstrations. The course is divided into 6 modules, and each module is further split into focused lessons. To reinforce learning, each module includes assignments in the form of quizzes and in-video questions. Course Modules Module 1: Building Core Concepts and Foundations of Machine Learning Module 2: ML Development, Data Preparation, and Evaluation Module 3: Unsupervised Learning Techniques – Clustering and Pattern Discovery Module 4: Advanced Machine Learning Techniques and GPU-Accelerated Workflows Module 5: Designing and Implementing Machine Learning Solutions on AWS Module 6: Building & Managing ML Workflows with Azure Machine Learning and MLOps This course is ideal for learners and professionals who want to build a strong foundation in machine learning and progress toward real-world, cloud-based ML implementations using industry-standard tools and best practices.

1. 基礎知識:データはあらゆるところにある
Google データアナリティクス プロフェッショナル認定プログラムの最初のコースです。各コースでは、初歩的なデータ アナリスト業務に必要なスキルを習得します。あらゆる組織で、プロセスの改善、商機とトレンドの見極め、新製品のリリース、慎重な意思決定などに、データ アナリストが必要とされています。このコースでは、Google が開発した実践的なカリキュラムを通じてデータ アナリティクスの世界を紹介します。教材では、データ アナリティクスに関する多数の主要トピックに触れながら、Google データアナリティクス プロフェッショナル認定プログラムの概要がわかるよう工夫されています。現職の Google データ アナリストが、最適なツールやリソースを使って、一般的なアナリスト業務を遂行する実践的な方法を指導します。 この認定プログラムを修了すると、エントリーレベルのデータ アナリスト職に応募できるようになります。過去の業務経験は不要です。 このコース修了後の目標は以下の通りです。 - ジュニア データ アナリストやアソシエート データ アナリストが日常的に関わる業務やプロセスを理解できるようになる。 - 専門的なツールボックスに追加できる、主要な分析スキル(データ クリーニング、データ分析、データの可視化)とツール(スプレッドシート、SQL、R プログラミング、Tableau)を習得する。 - データのライフサイクルやデータ分析プロセスなど、ジュニア データ アナリストの業務に関わる数多くの用語や概念を理解できるようになる。 - データ エコシステムにおけるアナリティクスの役割を評価できるようになる。 - 分析的思考について自己診断ができるようになる。 - コース修了後、求人情報を検索でき、求職活動のベストプラクティスを知る。
Python Foundations for Data Handling
This course features Coursera Coach! A smarter way to learn with interactive, real-time conversations that help you test your knowledge, challenge assumptions, and deepen your understanding as you progress through the course. In this course, you will explore the foundations of Python, focusing on key data handling techniques essential for real-world applications. By learning how to work with Python’s powerful libraries, you will become proficient in handling, manipulating, and visualizing data. You will gain a deep understanding of Python data structures, including lists, dictionaries, and strings, and how to apply them in data-related tasks. The course is structured to start with the basics, introducing Python strings and methods before moving into more advanced topics like data structures and object manipulation. You will get hands-on experience with data operations in Python, including insertion, deletion, and slicing, followed by quizzes to reinforce the concepts learned. Throughout the course, you will practice problem-solving techniques and explore abstract concepts that enhance your ability to work with complex data structures in Python. This course is ideal for beginners in Python programming who are interested in data analysis and handling. No prior programming experience is required, but a basic understanding of mathematics and logic will be helpful. The difficulty level is beginner, making it accessible to anyone new to programming or Python. By the end of the course, you will be able to manipulate and handle data structures efficiently, apply string operations, and utilize Python libraries to create data visualizations. You will also gain the ability to solve complex data handling problems using Python.
Debugging Machine Learning Models with Python
Debugging machine learning systems is a critical skill for building reliable, trustworthy, and high-performing AI solutions. This course teaches you how to identify, diagnose, and resolve issues throughout the machine learning lifecycle, helping you create models that are accurate, efficient, explainable, and production-ready. You will learn practical techniques to evaluate model behavior, improve performance, detect bias, manage risks, and implement testing strategies for machine learning applications. Through hands-on exploration of Python-based workflows, you will develop the ability to build reproducible pipelines, address data and concept drift, and strengthen model reliability in real-world environments. Unlike courses that focus only on model development, this course emphasizes systematic debugging and responsible AI practices. It combines foundational machine learning concepts with advanced topics such as deep learning, explainability, causality, security, privacy, and human-in-the-loop machine learning to bridge the gap between theory and industrial deployment. This course is ideal for data scientists, machine learning engineers, analysts, AI practitioners, and Python developers seeking to improve model quality and operational excellence. Learners should have basic Python programming knowledge and familiarity with machine learning concepts; the course is designed at an intermediate level.

Python: Apply & Evaluate Sales Forecasting with Time Series
Build practical skills in sales forecasting by applying time series analysis in Python to real-world datasets. This hands-on course is designed for learners with foundational Python knowledge who want to develop and evaluate forecasting models using structured analytical techniques. You will begin by preparing raw time series data through preprocessing, feature engineering, and visualization. As you progress, you will identify trend, seasonality, and noise using time series decomposition to create high-quality data for forecasting. Next, you will train and evaluate SARIMA models using statistical metrics and compare forecasting performance across multiple datasets and categories. The course also introduces the Facebook Prophet library, where you will prepare data, generate forecasts, visualize predictions, and assess model accuracy using Prophet's built-in support for trends, seasonality, and holidays. By the end of the course, you will be able to preprocess time series data, engineer forecasting features, build and evaluate SARIMA and Prophet models, compare forecasting approaches, and visualize results to support data-driven sales forecasting decisions. If you want practical experience applying Python-based forecasting techniques from data preparation through model evaluation, this course provides a structured, project-focused learning experience.

Kibana 8.x – A Quick Start Guide to Data Analysis
This course introduces learners to Kibana, focusing on its data exploration, visualization, and dashboard-building capabilities. With a structured approach, learners will be equipped to transform raw data into actionable insights using Kibana's powerful features. Practical examples and step-by-step guides ensure an intuitive understanding of Kibana’s interface. By the end, learners will be able to create and share interactive dashboards and use advanced analytics features to drive business decision-making. Designed for professionals, this course combines theoretical concepts with real-world applications. It equips learners to use Kibana for efficient data management and visualization, enhancing their analytics workflow. This hands-on guide allows learners to master Kibana through practical, expert-led lessons. Whether you're a data analyst or business user, this course will help you leverage Kibana for meaningful data analysis. This course is beneficial for data analysts, data engineers, and business users with a basic understanding of Elasticsearch. Knowledge of data analysis tools is recommended for the best experience.