Cursos de Datos e IA
Los mismos datos para todos, vengan de Udemy o de Coursera: precio, valoración, duración e idioma. 470 cursos encontrados. Afinar la búsqueda
Introduction to D3.js
This Guided Project, Introduction to D3.js is for those who want to learn about D3.js which is a JavaScript library for producing SVG-based, dynamic, interactive data visualizations in web browsers. In this 2-hour-long project-based course, you will get to know different SVG elements, build SVG-based webpages using D3.js, Integrate data into the SVG elements, and build simple data visualizations using D3.js. This project is unique because you will learn to build simple SVG-based data representations from scratch using D3.js. You will also learn how to integrate JSON data into your D3 data visualization. To be successful in this project, you will need to have knowledge of HTML, CSS, and Javascript programming language and to be experienced working with Visual Studio Code IDE.

Value Creation with Dark Data
In this course, you will learn next-level thinking about value creation with Dark Data, using a principled approach that demonstrates your ability to use dark data to add value to an end-deliverable.
Preparing Data for Analysis with Microsoft Excel
This course forms part of the Microsoft Power BI Analyst Professional Certificate. This Professional Certificate consists of a series of courses that offers a good starting point for a career in data analysis using Microsoft Power BI. No prior skills are needed to be successful in this course. In this course, you’ll learn how to make use of Excel in business scenarios for data analysis. You’ll also learn how to utilize formulas and functions for data analysis. Specifically, this course will help you gain knowledge and skills for preparing data for analysis using Microsoft Excel and take you one step closer to becoming a Microsoft Power BI Analyst. After completing this course, you’ll be able to: • Create data in Microsoft Excel and prepare it for data analysis. • Make use of common formulas and functions in a worksheet. • Prepare Excel data for analysis in Power BI using functions.

Gestiona un proyecto de datos en tu organización
Este curso te brindará las herramientas necesarias para identificar las bases y condiciones al implementar proyectos de datos en organizaciones del sector público o privado. A partir de un análisis de los activos de datos, procesos, recursos y metodologías podrás reconocer métodos o buenas prácticas en el ciclo de vida de proyectos de datos para tener las bases teóricas y prácticas del diseño e implementación. Este curso está pensado especialmente para todas aquellas personas que tengan interés en gestionar proyectos de datos, sin importar el nivel de experiencia que tengan con el tema. Si es tu primer acercamiento al mundo de los datos, ¡este curso es para ti! Este curso forma parte de una Especialización, te recomendamos realizar los cursos en el orden sugerido: 1) Uso de datos en las organizaciones del S.XXI: 2) Gestiona un proyecto de datos en tu organización 3) Estrategias efectivas en organizaciones data-driven

GenAI for Data Engineers: Scaling with GenAI
As part of the GenAI Academy, this course explores how Generative Artificial Intelligence (GenAI) is transforming the field of data engineering. This course serves as a primer where learners will discover the key capabilities of GenAI and uncover practical strategies to leverage these powerful tools in their day-to-day data engineering work. This course is designed for data engineering team leaders and data engineers, including managers and team leads who are responsible for guiding their teams towards innovative practices, as well as data engineers and aspiring professionals looking to enhance their workflows and future-proof their skillsets by incorporating GenAI-powered tools. Learners should have a basic understanding of data pipelines, ETL/ELT processes, and data transformation, along with familiarity with databases, data warehouses, big data frameworks, and programming languages like Python and SQL. An open mindset and curiosity to explore new GenAI technologies are essential. By the end of this course, data engineers will be equipped with the knowledge and skills to start scaling their productivity by harnessing the transformative potential of GenAI.

Microsoft PL-300 Exam Preparation and Practice
This course forms part of the Microsoft Power BI Analyst Professional Certificate. This Professional Certificate consists of a series of courses that offer a good starting point for a career in data analysis using Microsoft Power BI. This course will help you prepare for the Microsoft PL-300 exam. In this course, you’ll refresh your knowledge of all the key areas assessed in the Microsoft-certified Exam PL-300: Microsoft Power BI Data Analyst. In addition, you will prepare for the certification exam by taking a mock exam with a similar format and content as in the Microsoft PL-300 exam. You’ll also get tips and tricks, testing strategies, useful resources, and information on how to sign up for the Microsoft PL-300 proctored exam. This course is a great way to prepare for the Microsoft PL-300 exam. By passing the PL-300 exam, you’ll earn the Microsoft Power BI Data Analyst certification. Earning a Microsoft Certification is globally recognized evidence of real-world skills. After completing this course, you'll be able to: ● Prepare the data ● Model the data ● Visualize and analyze the data ● Deploy and maintain assets

Dark Data Basics - Understanding the Unknown
This course will help you learn the vocabulary and concepts necessary to understand- and use- Dark Data to create value for your organization.

How to Build a Diffusion Model - An Introduction
Explore the fascinating world of generative models with a deep focus on diffusion models for high-quality image generation. You’ll begin by mastering the core principles of diffusion and then advance to the architectures that power modern text-to-image systems. Learn how these models transform random noise into stunning visuals through forward and reverse processes, and discover optimization techniques using loss functions and training strategies. By the end of this course, you’ll be equipped to build your own diffusion models from scratch, fine-tune them for specific tasks, and evaluate their performance using real-world metrics. Whether you’re an ML engineer, data scientist, or AI enthusiast, this course will give you the practical skills to excel in one of the most transformative areas of generative AI.

Lab - Develop RAG Apps with Amazon Bedrock Knowledge Bases
In this lab, you build a question-answering application using the AnyCompany knowledge base and Amazon Bedrock's Retrieve and RetrieveAndGenerate APIs. You leverage the existing knowledge base, which contains comprehensive information about AnyCompany's products, services, corporate details like history, leadership, financial performance, sustainability efforts, and more. You run through various notebooks that can effectively answer questions related to AnyCompany's products, services, and corporate information.

Estrategias efectivas en organizaciones data-driven
En este curso podrás identificar los diferentes elementos de la gobernanza de datos, gobernanza democrática y el liderazgo en una organización basada en datos. Además, podrás reconocer los principios de las organizaciones basadas en datos para poder planificar y tomar decisiones basadas en evidencia. A través de actividades prácticas con casos para aplicar el contenido del curso, lograrás reconocer herramientas de evaluación basadas en datos que permitan visualizaciones eficaces para analizar, interpretar y comunicar datos. Si eres una persona interesada en datos pero no tienes experiencia previa o quieres reforzar los conocimientos ya adquiridos, ¡este curso es para ti! Este curso forma parte de una Especialización, te recomendamos realizar los cursos en el orden sugerido: 1) Uso de datos en las organizaciones del S.XXI: 2) Gestiona un proyecto de datos en tu organización 3) Estrategias efectivas en organizaciones data-driven

Introduction to Clinical Data Science
This course will prepare you to complete all parts of the Clinical Data Science Specialization. In this course you will learn how clinical data are generated, the format of these data, and the ethical and legal restrictions on these data. You will also learn enough SQL and R programming skills to be able to complete the entire Specialization - even if you are a beginner programmer. While you are taking this course you will have access to an actual clinical data set and a free, online computational environment for data science hosted by our Industry Partner Google Cloud. At the end of this course you will be prepared to embark on your clinical data science education journey, learning how to take data created by the healthcare system and improve the health of tomorrow's patients.
Data Extract, Transform, and Load in Power BI
In this course, you will learn the process of Extract, Transform and Load or ETL. You will identify how to collect data from and configure multiple sources in Power BI and prepare and clean data using Power Query. You’ll also have the opportunity to inspect and analyze ingested data to ensure data integrity. After completing this course, you’ll be able to: • Identify, explain and configure multiple data sources in Power BI • Clean and transform data using Power Query • Inspect and analyze ingested data to ensure data integrity

UX & SEO Analytics: Hotjar, Ahrefs & Competitor Intelligence
This course transforms how you approach digital analytics by expanding your capabilities into qualitative behavior analysis and SEO-driven intelligence. You’ll learn how to leverage tools like Hotjar and Ahrefs to uncover deep user insights, optimize user experiences, and improve search performance through data-driven strategies. You’ll start by exploring qualitative analytics using Hotjar. You’ll understand how users interact with your website, identify friction points, and validate tracking implementations to ensure accurate behavioral data collection. This foundation enables you to move beyond numbers and truly understand the “why” behind user actions. Next, you’ll dive into advanced behavior analysis techniques. You’ll analyze visual interaction patterns using heatmaps and zoning, evaluate user journeys through session replays, and design surveys to collect direct user feedback. These insights will help you identify usability issues, improve user experience, and drive meaningful optimization decisions. Finally, you’ll focus on SEO analytics and competitive intelligence using Ahrefs. You’ll learn how search engines work, conduct technical SEO audits, analyze backlink profiles, and develop keyword strategies based on search intent. You’ll also explore competitor analysis to identify gaps, uncover opportunities, and improve your website’s visibility in search results. By the end of this course, you will be able to: -Apply qualitative analytics techniques to capture and interpret real user behavior on websites. -Analyze heatmaps, session replays, and survey data to identify UX issues and optimization opportunities. -Execute technical SEO audits and resolve critical issues impacting search performance. -Evaluate backlink profiles and perform competitive analysis to strengthen search authority. -Develop keyword strategies based on search intent to improve content visibility and ranking. -Integrate behavioral insights and SEO intelligence to drive data-informed optimization strategies. Designed for digital analysts, UX researchers, SEO specialists, product managers, and marketing professionals, this course equips you with the practical skills and analytical mindset needed to bridge user behavior insights with search performance optimization. Step in, elevate your analytics capabilities, and learn how to transform user behavior data and SEO intelligence into strategies that drive measurable growth and performance.

Análisis de datos con programación en R
Este es el séptimo curso del Certificado de análisis computacional de datos de Google. En estos cursos obtendrás las habilidades necesarias para solicitar empleos de analista de datos de nivel introductorio. En este curso, aprenderás el lenguaje de programación conocido como R. Además, se profundizará en cómo usar RStudio, el entorno que te permite trabajar con R, y se cubrirán temas como las aplicaciones y las herramientas de software que son exclusivas para R, como los paquetes de R. Descubrirás cómo R te brinda más alternativas para limpiar, organizar, analizar, visualizar e informar los datos con mayor eficacia. Los analistas de datos actuales de Google seguirán dándote instrucciones y te proporcionarán formas prácticas de llevar a cabo las tareas comunes de los analistas de datos con las mejores herramientas y recursos. Los alumnos que completen este programa de certificados estarán listos para solicitar trabajos de nivel introductorio como analistas de datos. No se requiere experiencia previa. Al final de este curso, serás capaz de: - Analizar los beneficios de usar el lenguaje de programación en R. - Descubrir cómo usar RStudio para aplicar R en tus análisis. - Explorar los conceptos básicos relacionados con la programación en R. - Explorar el contenido y los componentes de los paquetes de R, incluido el paquete Tidyverse. - Comprender las tramas de datos y su uso en R. - Descubrir las opciones de generación de visualizaciones en R. - Aprender sobre R Markdown para documentar la programación en R.

Developing Data Models with LookML
This course empowers you to develop scalable, performant LookML (Looker Modeling Language) models that provide your business users with the standardized, ready-to-use data that they need to answer their questions. Upon completing this course, you will be able to start building and maintaining LookML models to curate and manage data in your organization’s Looker instance.

Unify Multimodal Data with Automated ETL
Did you know that multimodal AI systems often fail not because of weak models, but because their underlying data pipelines cannot reliably unify text, image, audio, and tabular features? A strong multimodal infrastructure is the foundation of advanced AI. This Short Course was created to help professionals in this field build robust data infrastructure for multimodal AI applications and automate the processing of diverse data types including text, images, and audio. By completing this course, you will be able to design unified schemas for multimodal feature storage and implement automated ETL pipelines using workflow orchestration tools, giving you the ability to support scalable, production-ready multimodal AI systems. By the end of this 4-hour long course, you will be able to: Create a unified data schema for storing multimodal machine learning features. Implement automated ETL pipelines using a workflow orchestration tool. This course is unique because it combines multimodal feature engineering with automation and orchestration, equipping you to transform fragmented datasets into cohesive, high-quality pipelines that power next-generation AI models. To be successful in this project, you should have: Database design fundamentals Basic ETL concepts SQL proficiency Familiarity with cloud storage ML feature engineering basics

Software Development with ChatGPT: Generating Code with AI
In this 1-hour long project-based course, you will learn how to: 1) Set up a development environment incorporating ChatGPT, 2) Generate and integrate AI-assisted code into a Python project, 3) Debug and refine your application using AI guidance, and 4) Write comprehensive documentation with the help of ChatGPT. To achieve these goals, you will create a functional Python To-Do List Manager by working through a series of practical, real-world scenarios. This project is unique because it not only enhances your Python coding skills but also introduces you to the revolutionary world of AI-assisted programming, providing a glimpse into the future of software development. This course is tailored for those with a basic understanding of Python who are keen to explore AI applications in programming. No prior experience with ChatGPT is necessary, making it a perfect opportunity for anyone familiar with core programming concepts to step into the AI-assisted coding arena.
Analyze & Visualize Data Using Advanced Excel
By completing this course, learners will be able to analyze structured datasets, apply Pivot Tables for meaningful summaries, design effective charts, interpret data using advanced visualization techniques, and perform dynamic calculations using Excel equations and intelligent analysis tools. This Advanced Excel course is designed to help learners move beyond basic spreadsheet usage and develop strong analytical and visualization skills required in today’s data-driven roles. Learners will gain hands-on experience in understanding dataset structure, building Pivot Tables, and transforming raw data into clear, insightful charts. The course also explores advanced chart formatting, dataset parameters, and Excel’s smart features such as Analyze Data and recommended charts to enhance accuracy and efficiency. What makes this course unique is its structured, outcome-driven approach that connects data preparation, visualization, and analysis into a single learning journey. Each concept is reinforced through practical examples that mirror real-world business scenarios, enabling learners to make confident, data-backed decisions. Whether for reporting, analytics, or dashboard creation, this course equips learners with practical Advanced Excel skills that are immediately applicable in professional environments.
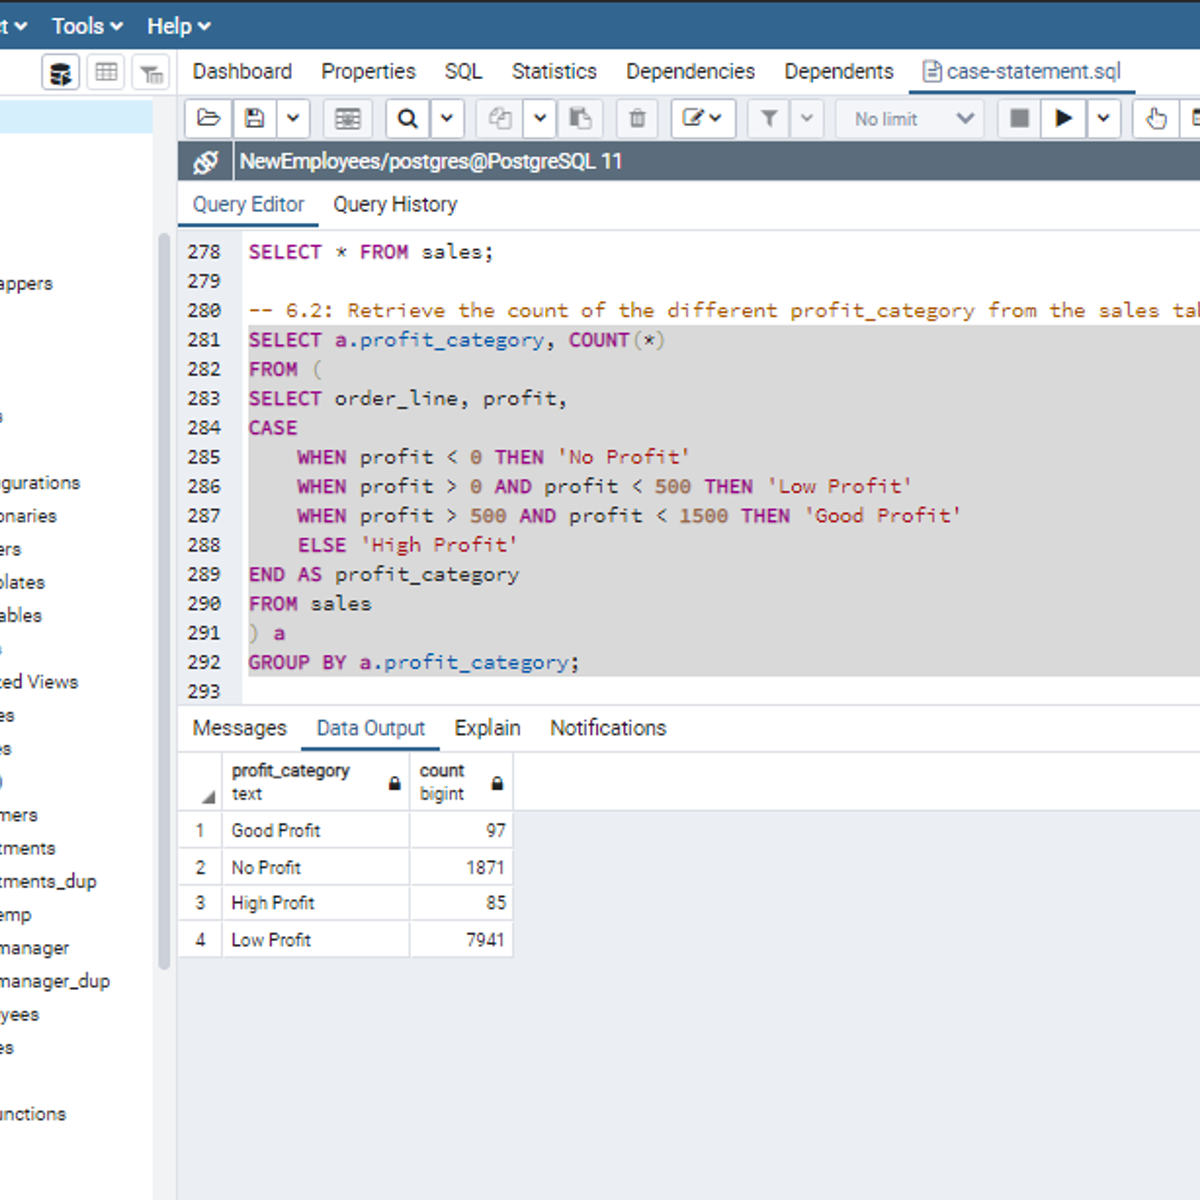
SQL CASE Statements
Welcome to this project-based course, SQL CASE Statements. In this project, you will learn how to use SQL CASE statements to query tables in a database. By the end of this 2-hour long project, you will be able to write simple CASE statements to retrieve the desired result from a database. Then, we will move systematically to write more complex SQL CASE statements. Furthermore, we will see how to use the CASE clause together with aggregate functions, and SQL joins to get the desired result you want from tables in a database. Also, you will learn how to use the CASE clause to transpose the result of a query. Also, for this hands-on project, we will use PostgreSQL as our preferred database management system (DBMS). Therefore, to complete this project, it is required that you have prior experience with using PostgreSQL. Similarly, this project is an advanced SQL concept; so, a good foundation for writing SQL queries, and performing joins in SQL is vital to complete this project. If you are not familiar with writing queries in SQL and SQL joins and want to learn these concepts, start with my previous guided projects titled “Querying Databases using SQL SELECT statement", “Performing Data Aggregation using SQL Aggregate Functions” and “Mastering SQL Joins”. I taught these guided projects using PostgreSQL. So, taking these projects will give the needed requisite to complete this project on SQL CASE Statements. However, if you are comfortable writing queries in PostgreSQL, please join me on this wonderful ride! Let’s get our hands dirty!

Generalized Linear Models and Nonparametric Regression
In the final course of the statistical modeling for data science program, learners will study a broad set of more advanced statistical modeling tools. Such tools will include generalized linear models (GLMs), which will provide an introduction to classification (through logistic regression); nonparametric modeling, including kernel estimators, smoothing splines; and semi-parametric generalized additive models (GAMs). Emphasis will be placed on a firm conceptual understanding of these tools. Attention will also be given to ethical issues raised by using complicated statistical models. This course can be taken for academic credit as part of CU Boulder’s Master of Science in Data Science (MS-DS) degree offered on the Coursera platform. The MS-DS is an interdisciplinary degree that brings together faculty from CU Boulder’s departments of Applied Mathematics, Computer Science, Information Science, and others. With performance-based admissions and no application process, the MS-DS is ideal for individuals with a broad range of undergraduate education and/or professional experience in computer science, information science, mathematics, and statistics. Learn more about the MS-DS program at https://www.coursera.org/degrees/master-of-science-data-science-boulder. Logo adapted from photo by Vincent Ledvina on Unsplash

Generative AI Tools for Modern Software Engineering
This program offers a structured journey into the transformative world of AI-powered code understanding, quality assurance, and intelligent development workflows. Designed for developers, software engineers, and technical leads, this course empowers you to leverage cutting-edge AI tools for efficient code navigation, review, debugging, security, and optimization. By the end of this program, you will be able to: - Analyze and explore large codebases quickly with AI tools for faster understanding and onboarding. - Review and evaluate code automatically to ensure high-quality, reliable, and maintainable software. - Create, refactor, and debug code efficiently using intelligent AI-powered assistants. - Secure applications by detecting vulnerabilities, managing dependencies, and enhancing code safety. - Optimize and improve performance with AI-driven profiling, tuning, and resource management tools. This program is ideal for software engineers, AI professionals, and tech leads aiming to enhance their coding workflows with AI. A foundational understanding of programming concepts, version control, and basic software development practices is recommended. Join us to unlock the power of AI in software engineering and transform the way you navigate, build, and maintain code.
Automated Report Generation with Generative AI
In today's data-driven world, generating reports efficiently is a valuable skill for professionals across various industries. This course introduces beginners to the world of automated report generation using AI-powered tools and techniques. You will learn how to leverage the capabilities of artificial intelligence to streamline the reporting process, save time, and improve data accuracy. By the end of this course, you will not only grasp foundational concepts but also have the skills to streamline your personal and professional life; whether it's tracking and reporting on your personal finances, health and wellness, home energy efficiency, or implementing automated reporting solutions for your company's sales or marketing, saving valuable time and resources while improving data accuracy and decision-making. Moreover, you'll have the knowledge and confidence to explore automation opportunities within your workplace, making you an asset in the digital transformation era. Upon completing this course, learners can utilize AI-driven tools to generate automated reports, thereby improving productivity and data accuracy in their respective fields. Audience: Office Professionals, Consultants, Students, Small Business Owners, Reporting and Automation Enthusiasts To fully benefit from the " Introduction to Automated Report Generation with AI " course, learners should have basic computer skills, familiarity with software, an interest in data, analytics, and reporting, and access to a computer or device for practice.

Power BI: Data Modeling and Data Analysis
This course is designed to provide a comprehensive foundation in Power BI, equipping learners with the skills to model, analyze, and visualize data efficiently. Participants will begin by exploring calculated columns and tables, understanding their use cases in data modeling and performance optimization. The course progresses to advanced data modeling in Power BI, covering essential techniques like STAR schema design, model relationships, hierarchies, and role-playing dimensions to optimize data structures. Learners will gain expertise in DAX functions, including numerical calculations, measures, quick measures, and analytical queries, ensuring efficient data manipulation. Additionally, this course covers Power BI Desktop features, enabling participants to create calculation groups, work with DAX query view, and improve performance by reducing granularity. Features like date-time formatting, advanced settings in model view, and restricting access to model data are explored to enhance analytical capabilities. This course is structured into multiple modules, each featuring lessons and video lectures that provide both theoretical understanding and hands-on practice. Participants will engage with 3:00–4:00 hours of instructional content, reinforcing learning through graded and ungraded assignments, ensuring real-world applicability. Whether you're preparing for Power BI certification or seeking to optimize business intelligence workflows, this course equips you with the essential skills to master data modeling, DAX, and visualization for effective analytics. Module 1 - Optimizing Data Models and Performance with DAX in Power BI Module 2 - Power BI Data Modeling: STAR Schema, DAX, and Advanced Modeling Techniques The course is for the Data Managers, Data Analysts, Power BI Associates, and Power BI Experts
Vision AI and Advanced OpenAI
Once you can build with text, the next step is multimodal AI and enterprise-scale capabilities. This course advances your OpenAI skills into image generation, advanced production API features, and the foundational AWS architecture knowledge you need to design serious generative AI systems. You'll start with OpenAI's vision capabilities: how DALL-E generates images from natural language prompts, the evolution from DALL-E 1 to DALL-E 3, and how CLIP connects visual and language understanding. You'll build a working image generator and an image captioning pipeline, and examine the ethical challenges and future trends shaping AI vision technologies. Next, you'll implement OpenAI's most powerful production features — function calling, structured outputs, batch processing, and content moderation — the capabilities that separate prototype applications from scalable, enterprise-grade systems. The course closes with a critical knowledge bridge into AWS: tokens, embeddings, chunking, context windows, the foundation model lifecycle, AWS GenAI infrastructure design, and cost optimisation principles — preparing you for AWS-native deployment. Designed for learners who have OpenAI API experience. Basic programming knowledge is recommended.
Data Modeling in Power BI
This course forms part of the Microsoft Power BI Analyst Professional Certificate. This Professional Certificate consists of a series of courses that offers a good starting point for a career in data analysis using Microsoft Power BI. In this course, you'll learn how to use Power BI to create and maintain relationships in a data model and form a model using multiple Schemas. You'll explore the basics of DAX, Power BI's expression language, and add calculations to your model to create elements and analysis in Power BI. You'll discover how to configure the model to support Power BI features for insightful visualizations, analysis, and optimization. After completing this course you'll be able to: ● Create and maintain relationships in a data model. ● Form a model using a Star Schema ● Write calculations DAX to create elements and analysis in Power BI ● Create calculated columns and measures in a model ● Perform useful time intelligence calculations in DAX ● Optimize performance in a Power BI model This is also a great way to prepare for the Microsoft PL-300 exam. By passing the PL-300 exam, you’ll earn the Microsoft Power BI Data Analyst certification.

Data Visualization and Modeling in Python
Put the keystone in your Python Data Science skills by becoming proficient with Data Visualization and Modeling. This course is suited for intermediate programmers, who have some experience with NumPy and Pandas, that want to expand their skills for any career in data science. Whether you come to data science through social sciences and Statistics, or from a programming background, this course will integrate the two perspectives and offer unique insights from each. You’ll begin by becoming adept with matplotlib, an essential plotting library in Python that will enable you to discover and communicate insights about data effectively. You’ll progress to classification algorithms by creating a K-Nearest Neighbors (KNN) classifier, a foundational algorithm used in data science and machine learning. Finally, you will write Python programs that leverage your newfound data science skills based on inferential statistics, and be able to describe relationships between variables in your data. By the end of the course, you’ll be able to quickly visualize a dataset, explore it for insights, determine relationships between data, and communicate it all with effective plots. In the last module of this course, you’ll produce a publication-quality figure based on data that you’ve prepared and cleaned yourself; the first artifact in your data science portfolio. Throughout this course you’ll get plenty of hands-on experience through interactive programming assignments, live coding demos from data scientists, and analyzing the data behind important real-world problems (like carbon emissions, real estate prices, and infant mortality). Guided activities throughout each module will reinforce your proficiency with data science techniques and analytical approach as a data scientist. Solidify your understanding of these critical data science concepts and begin your data science portfolio by mastering visualization and modeling. Start this integrative and transformative learning journey today!
Knowledge Graphs for RAG
Knowledge graphs are used in development to structure complex data relationships, drive intelligent search functionality, and build powerful AI applications that can reason over different data types. Knowledge graphs can connect data from both structured and unstructured sources (databases, documents, etc.), providing an intuitive and flexible way to model complex, real-world scenarios. Unlike tables or simple lists, knowledge graphs can capture the meaning and context behind the data, allowing you to uncover insights and connections that would be difficult to find with conventional databases. This rich, structured context is ideal for improving the output of large language models (LLMs), because you can build more relevant context for the model than with semantic search alone. This course will teach you how to leverage knowledge graphs within retrieval augmented generation (RAG) applications. You’ll learn to: 1. Understand the basics of how knowledge graphs store data by using nodes to represent entities and edges to represent relationships between nodes. 2. Use Neo4j’s query language, Cypher, to retrieve information from a fun graph of movie and actor data. 3. Add a vector index to a knowledge graph to represent unstructured text data and find relevant texts using vector similarity search. 4. Build a knowledge graph of text documents from scratch, using publicly available financial and investment documents as the demo use case 5. Explore advanced techniques for connecting multiple knowledge graphs and using complex queries for comprehensive data retrieval. 6. Write advanced Cypher queries to retrieve relevant information from the graph and format it for inclusion in your prompt to an LLM. After course completion, you’ll be well-equipped to use knowledge graphs to uncover deeper insights in your data, and enhance the performance of LLMs with structured, relevant context.

Agentic AI Content for Practitioners: Marketing
Enhance Marketing with AI: Tools for Optimal Campaigns is an intermediate-level course designed for marketing professionals ready to harness artificial intelligence for transformative campaign results. In today's data-driven marketing landscape, AI tools are no longer optional—they're essential for competitive advantage. This course equips you with practical skills to implement AI agents for automation, master prompt engineering for brand-aligned content creation, and integrate analytics tools for comprehensive performance tracking. Through real-world case studies from Nike, Coca-Cola, and IBM Watson, you'll learn to transform manual marketing processes into intelligent, data-driven workflows. The course combines strategic frameworks with hands-on applications, enabling you to immediately apply AI tools to your marketing challenges. By completion, you'll have the knowledge to design AI-powered campaigns that save time, improve targeting, and deliver measurable business results. Whether you're optimizing social media strategies, creating compelling content, or analyzing customer journeys, this course provides the AI marketing foundation you need to lead in the digital age.
Defining, Describing, and Visualizing Data
As leaders in your chosen field, you need to not only know how to ask the right questions but also answer them using data-based methods. Through this class, you will be able to get to the bottom of what you really want to know, describe the associated data related to that question, and visualize the information from that data to understand and explain the results. This course can be taken for academic credit as part of CU Boulder’s Master of Engineering in Engineering Management (ME-EM) degree offered on the Coursera platform. The ME-EM is designed to help engineers, scientists, and technical professionals move into leadership and management roles in the engineering and technical sectors. With performance-based admissions and no application process, the ME-EM is ideal for individuals with a broad range of undergraduate education and/or professional experience. Learn more about the ME-EM program at https://www.coursera.org/degrees/me-engineering-management-boulder.
Deep Learning with PyTorch : GradCAM
Gradient-weighted Class Activation Mapping (Grad-CAM), uses the class-specific gradient information flowing into the final convolutional layer of a CNN to produce a coarse localization map of the important regions in the image. In this 2-hour long project-based course, you will implement GradCAM on simple classification dataset. You will write a custom dataset class for Image-Classification dataset. Thereafter, you will create custom CNN architecture. Moreover, you are going to create train function and evaluator function which will be helpful to write the training loop. After, saving the best model, you will write GradCAM function which return the heatmap of localization map of a given class. Lastly, you plot the heatmap which the given input image.

Interpretable Machine Learning Applications: Part 1
In this 1-hour long project-based course, you will learn how to create interpretable machine learning applications on the example of two classification regression models, decision tree and random forestc classifiers. You will also learn how to explain such prediction models by extracting the most important features and their values, which mostly impact these prediction models. In this sense, the project will boost your career as Machine Learning (ML) developer and modeler in that you will be able to get a deeper insight into the behaviour of your ML model. The project will also benefit your career as a decision maker in an executive position, or consultant, interested in deploying trusted and accountable ML applications.

Navigating Generative AI Risks for Leaders
This course delves into the various risks and concerns associated with Generative AI, including business model risks, inaccuracies in AI-generated content, data security, and privacy concerns. It emphasizes the importance of the CEO in understanding and addressing these risks. A significant part of this course is dedicated to exploring the ethical considerations for using GenAI. It highlights the importance of developing responsible AI principles and practices, guiding CEOs in creating ethical principles for Responsible AI tailored specifically to their own companies. The course also focuses on the critical issues of data security and privacy in the use of GenAI. It concludes by providing an overview of the legal and regulatory landscape for GenAI, offering guidance on how to navigate this landscape effectively and ensure legal and regulatory compliance in the use of GenAI.

Data Visualization in Stata
Updated in May 2025. This course now features Coursera Coach! A smarter way to learn with interactive, real-time conversations that help you test your knowledge, challenge assumptions, and deepen your understanding as you progress through the course. Data visualization is a crucial skill in the realm of data analysis, and this course is designed to elevate your proficiency with Stata, a powerful statistical software. Beginning with an introduction to continuous and discrete data, the course progresses through a series of detailed modules, each focusing on specific types of plots. You’ll explore the nuances of creating and interpreting histograms, density plots, and scatter plots, among others, while understanding how each visualization technique can be leveraged to convey data insights effectively. The course places a strong emphasis on practical application, guiding you step-by-step through the process of creating these plots using Stata. You'll learn not only how to generate these visualizations but also how to interpret them, providing a solid foundation for data-driven decision-making. Each section is designed to build on the previous one, ensuring a cohesive learning experience that enhances your ability to present data in a clear, concise, and visually appealing manner. By the end of this course, you will be equipped with a comprehensive toolkit of data visualization techniques. Whether dealing with single variables or complex datasets involving multiple variables, you’ll have the skills needed to create and customize plots that effectively communicate your analytical findings. This course is essential for anyone looking to advance their data analysis capabilities with Stata. This course is tailored for data analysts, researchers, and professionals in the fields of statistics and data science who want to enhance their data visualization skills using Stata. A basic understanding of Stata is recommended but not required.
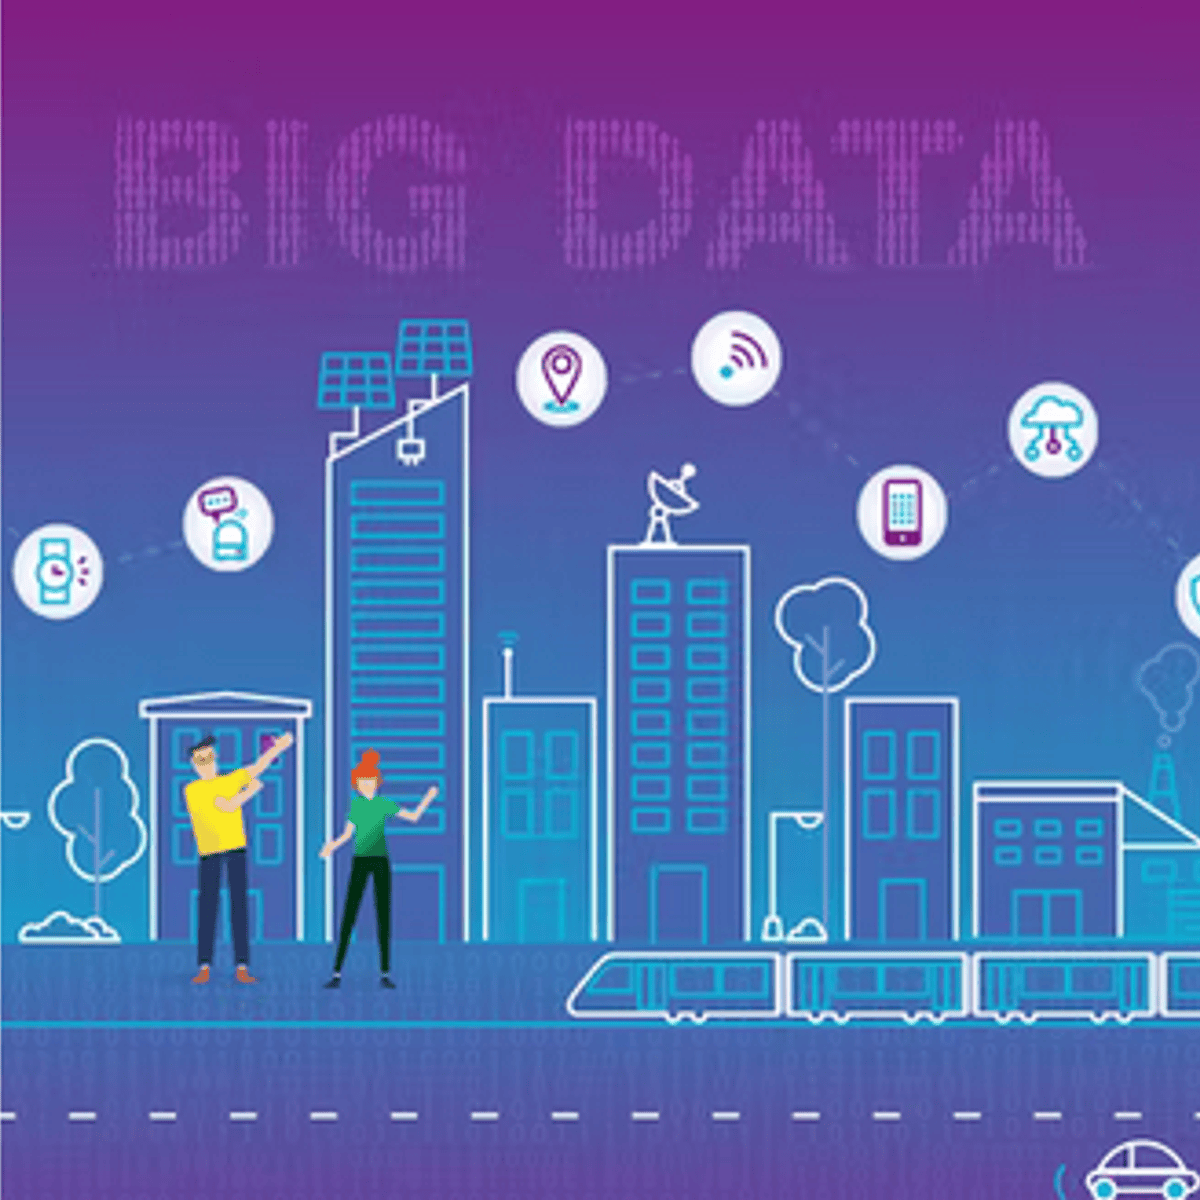
Data intelligence for businesses and managers
With the proliferation of connected objects (computers, tablets, watches, etc.), huge masses of data are generated every second. This Big Data has led to the emergence of a data economy, where data is the main source of competitive advantage for companies. In this sense, data and its processing tools have become a strategic priority for companies, and the main gas pedal of their digital transformation. ----------------------------------------------------------------------------------------------------------------------------------------- This MOOC addresses the role of data in the digital transformation of organizations through 10 course sequences spread over 5 weeks and a wide variety of content: - Slideshows and video-scribes explaining the impact of data on businesses, the digital transformation needed to capitalize on data, and the tools, methods and technologies needed to implement these data-driven strategies. - Videos featuring testimonials from professionals and academics, highlighting through concrete examples the importance of data as a catalyst for digital transformation and a source of competitive advantage. - Compulsory reading to complement the topics covered in the slides and video, in particular the challenges and benefits of data management as part of digital transformation. - MCQs covering the entire content of each chapter. A certificate is awarded for any grade above 50%. This MOOC has received financial support from the Patrick & Lina Drahi Foundation.

Supervised Machine Learning: Regression
This course introduces you to one of the main types of modelling families of supervised Machine Learning: Regression. You will learn how to train regression models to predict continuous outcomes and how to use error metrics to compare across different models. This course also walks you through best practices, including train and test splits, and regularization techniques. By the end of this course you should be able to: Differentiate uses and applications of classification and regression in the context of supervised machine learning Describe and use linear regression models Use a variety of error metrics to compare and select a linear regression model that best suits your data Articulate why regularization may help prevent overfitting Use regularization regressions: Ridge, LASSO, and Elastic net Who should take this course? This course targets aspiring data scientists interested in acquiring hands-on experience with Supervised Machine Learning Regression techniques in a business setting. What skills should you have? To make the most out of this course, you should have familiarity with programming on a Python development environment, as well as fundamental understanding of Data Cleaning, Exploratory Data Analysis, Calculus, Linear Algebra, Probability, and Statistics.
Stability and Capability in Quality Improvement
In this course, you will learn to analyze data in terms of process stability and statistical control and why having a stable process is imperative prior to perform statistical hypothesis testing. You will create statistical process control charts for both continuous and discrete data using R software. You will analyze data sets for statistical control using control rules based on probability. Additionally, you will learn how to assess a process with respect to how capable it is of meeting specifications, either internal or external, and make decisions about process improvement. This course can be taken for academic credit as part of CU Boulder’s Master of Science in Data Science (MS-DS) degree offered on the Coursera platform. The MS-DS is an interdisciplinary degree that brings together faculty from CU Boulder’s departments of Applied Mathematics, Computer Science, Information Science, and others. With performance-based admissions and no application process, the MS-DS is ideal for individuals with a broad range of undergraduate education and/or professional experience in computer science, information science, mathematics, and statistics. Learn more about the MS-DS program at https://www.coursera.org/degrees/master-of-science-data-science-boulder.

Introduction to CNN Training
This beginner-friendly course on Convolutional Neural Networks (CNNs) equips you with essential skills to understand deep learning fundamentals and apply them to real-world image recognition tasks. Learn how CNNs power modern AI applications and gain practical experience through guided lab demos. Build confidence in designing, training, and implementing CNN models effectively. By the end of this course, you will be able to: Understand CNN Basics: Explain what CNNs are and their role in deep learning and computer vision Explore Core Components: Learn about convolution, ReLU, and pooling layers in CNNs Recognize Image Processing: Understand how CNNs detect and classify image features Apply CNN Models: Build and implement CNN models through hands-on guided labs Gain Practical Skills: Develop expertise to handle real-world image classification projects Ideal for beginners, and professionals interested in AI, computer vision, and deep learning.

Foundations of Deep Reinforcement Learning with PyTorch
This course provides a deep dive into reinforcement learning (RL) with a focus on practical applications using PyTorch. You'll explore core concepts like the OpenAI Gym API, deep Q-networks, and advanced RL libraries. As RL becomes increasingly important in fields like AI, robotics, and gaming, mastering this skill will help you stay ahead in the rapidly evolving tech industry. Through hands-on projects and real-world scenarios, you'll enhance your problem-solving abilities and gain practical expertise in building RL models. The course covers a wide range of topics, from tabular learning and the Bellman equation to complex deep Q-networks, ensuring that you develop both foundational and advanced RL skills. What sets this course apart is its blend of theoretical knowledge with practical coding exercises. You'll learn how to implement RL algorithms using PyTorch while understanding the underlying math and principles, providing a well-rounded approach to mastering reinforcement learning. This course is perfect for professionals and students with a background in machine learning or Python programming. Prior knowledge of deep learning or neural networks will be helpful but not required to start. This course is part one of a three-course Specialization designed to provide a comprehensive learning pathway in Reinforcement Learning. While it delivers standalone value, learners seeking an in-depth progression may benefit from completing the full Specialization.

Введение в анализ данных с помощью Excel
Использование Excel широко распространено в отрасли. Это очень мощный инструмент анализа данных, и почти все крупные и малые предприятия используют Excel в своей повседневной работе. Это вводный курс по использованию Excel, который предоставляет знания о работе в Excel с целью ее использования для более продвинутых тем деловой статистики позже. Курс разработан с учетом двух типов учащихся — тех, у кого очень мало функциональных знаний о Excel, и тех, кто регулярно использует Excel, но на периферийном уровне и хочет развить свои навыки. Курс включает в себя базовые операции, такие как импорт данных в Excel с использованием различных форматов данных, организацию и управление данными, а также некоторые более продвинутые функции Excel. В целом, знакомство с функциями Excel проходит на базе простых для понимания примеров, которые демонстрируются таким образом, чтобы учащимся не составило труда понять и применить их. Для успешного прохождения курсов учащиеся должны иметь доступ к Microsoft Excel 2010 или более поздней версии для Windows. ________________________________________ НЕДЕЛЯ 1 Модуль 1: Введение в электронные таблицы В этом модуле вы познакомитесь с использованием электронных таблиц Excel и различными базовыми функциями данных Excel. Рассматриваемые темы включают: • Импорт данных в Excel с использованием различных форматов • Основные функции в Excel, арифметические и различные логические функции • Форматирование строк и столбцов • Использование формул в Excel и их копирование с использованием абсолютных и относительных ссылок ________________________________________ НЕДЕЛЯ 2 Модуль 2: Функции электронной таблицы для организации данных В этом модуле представлены различные функции Excel для организации и запроса данных. Участники знакомятся с функциями ЕСЛИ, ВПР и ГПР и вложенной функцией ЕСЛИ в Excel. Рассматриваемые темы включают: • Функция ЕСЛИ и вложенная функция ЕСЛИ • ВПР и ГПР • Функция СЛУЧМЕЖДУ ________________________________________ НЕДЕЛЯ 3 Модуль 3: Введение в фильтры, сводные таблицы и диаграммы В этом модуле представлены различные возможности фильтрации данных в Excel. Вы узнаете, как настраивать фильтры для избирательного доступа к данным. Также объясняется очень мощный инструмент обобщения данных, сводная таблица, и мы начинаем вводить функцию построения диаграмм в Excel. Рассматриваемые темы включают: • ВПР и рабочие листы • Фильтрация данных в Excel • Использование сводных таблиц с категориальными и числовыми данными • Введение в возможности построения диаграмм в Excel ________________________________________ НЕДЕЛЯ 4 Модуль 4: Расширенные возможности построения графиков и диаграмм В этом модуле рассматриваются различные продвинутые методы построения графиков и диаграмм, доступные в Excel. Начиная с различных линейных, столбчатых и круговых диаграмм, мы представляем сводные диаграммы, точечные графики и гистограммы. Вы научитесь понимать эти различные диаграммы и начнете строить их самостоятельно. Рассматриваемые темы включают: • Линейные, столбчатые и круговые диаграммы • Сводные диаграммы • Точечные графики • Гистограммы

Integrate Embeddings and Chroma
Vector Databases for Machine Learning: A Comprehensive Guide - Integrate Embeddings and Chroma is an intermediate-level course designed for machine learning engineers and AI practitioners aiming to build robust, automated data ingestion pipelines. In modern AI applications, the success of vector search hinges on the seamless integration of embedding models with a vector database. This course provides the critical, hands-on skills to master that integration using ChromaDB. You will move beyond theory to implement and troubleshoot a full vectorization pipeline. Through expert-led screencasts and hands-on labs, you will learn to connect both API-based (like OpenAI) and open-source (like HuggingFace) embedding models to ChromaDB, enabling automatic vectorization on data upload. The curriculum is built around real-world failure scenarios, teaching you to systematically diagnose and resolve common but critical errors, such as vector dimension mismatches and data encoding issues. By the end of this course, you won't just build a pipeline; you'll be able to ensure its reliability, a crucial skill for deploying production-grade machine learning systems.

Machine Learning with Python: Build & Optimize
Master the machine learning lifecycle with Python, from data preparation and visualization to model evaluation and optimization. You’ll begin with core machine learning concepts and build practical skills in numerical computing with NumPy and structured data analysis using Pandas. You’ll then create and customize visualizations with Matplotlib, apply scaling and encoding techniques, and develop scikit-learn pipelines for efficient preprocessing and feature engineering. As you progress, you’ll construct and evaluate linear and polynomial regression models, apply decision trees, random forests, and support vector machines to classification tasks, and use ensemble learning methods. You’ll also perform clustering with KMeans, apply principal component analysis (PCA) for dimensionality reduction, and improve model performance through hyperparameter tuning. Designed for aspiring data science professionals and learners seeking practical analytical skills, this course connects machine learning theory with hands-on coding and end-to-end workflows. By completing the course, you’ll be able to prepare and explore datasets, select appropriate modeling techniques, evaluate results, and optimize machine learning models for data-driven problems. Enroll to develop a practical foundation in applied machine learning with Python and gain experience across the complete modeling workflow.

Essential Design Principles for Tableau
In this course, you will analyze and apply essential design principles to your Tableau visualizations. This course assumes you understand the tools within Tableau and have some knowledge of the fundamental concepts of data visualization. You will define and examine the similarities and differences of exploratory and explanatory analysis as well as begin to ask the right questions about what’s needed in a visualization. You will assess how data and design work together, including how to choose the appropriate visual representation for your data, and the difference between effective and ineffective visuals. You will apply effective best practice design principles to your data visualizations and be able to illustrate examples of strategic use of contrast to highlight important elements. You will evaluate pre-attentive attributes and why they are important in visualizations. You will exam the importance of using the "right" amount of color and in the right place and be able to apply design principles to de-clutter your data visualization.

Analyse de données avec la programmation R
Ce cours est le septième du Google Data Analytics Certificate. Ces cours vous permettront d’acquérir les compétences dont vous avez besoin pour postuler les emplois d’analyste de données de niveau junior. Dans ce cours, vous découvrirez le langage de programmation R. Vous découvrirez comment utiliser RStudio, l'environnement qui vous permet de travailler avec R. Ce cours abordera également les applications logicielles et les outils spécifiques à R, tels que les packs R. Vous découvrirez comment R vous permet de nettoyer, d'organiser, d'analyser, de visualiser et d’élaborer des rapports de données de manière nouvelle et plus efficace. Des analystes de données actuellement chez Google vous instruiront et vous fourniront des moyens pratiques d’accomplir les tâches courantes des analystes de données, avec les meilleurs outils et ressources. Les participants qui terminent cette formation certifiante seront préparés à postuler des emplois d’analyste de données de niveau junior. Aucune expérience préalable n’est nécessaire. D’ici la fin de ce cours, vous : - Examinerez les avantages de l'utilisation du langage de programmation R. - Découvrirez comment utiliser RStudio afin d’appliquer R à votre analyse. - Découvrirez les concepts fondamentaux associés à la programmation dans R. - Examinerez le contenu et les composants des packs R, y compris le pack Tidyverse. - Comprendrez les trames de données et leur utilisation dans R. - Découvrirez les options de génération de visualisations dans R - Apprendrez R Markdown pour documenter la programmation R.

Applied No-Code AI for Business Processes
Take action on business automation and innovation using no-code AI platforms. This course delivers hands-on frameworks for selecting, implementing, and tracking AI-powered process improvements—from data collection to workflow automation to stakeholder reporting. By emphasizing regional nuances in the USA and Indian business landscapes, learners acquire critical thinking tools, measuring methods, and ethical approaches to lead sustainable AI projects.

Master in Microsoft Power BI Desktop and Service
This course features Coursera Coach! A smarter way to learn with interactive, real-time conversations that help you test your knowledge, challenge assumptions, and deepen your understanding as you progress through the course. In this comprehensive course, you will gain a deep understanding of Microsoft Power BI and how to effectively use it for data analysis and visualization. The course covers everything from basic business intelligence concepts to more advanced topics such as data modeling, DAX functions, and creating interactive dashboards. By mastering these skills, you'll be able to make informed business decisions using powerful visualizations and data insights. The course begins with an introduction to business intelligence concepts, followed by detailed instructions on setting up and connecting Power BI with various data sources such as Excel, SQL Server, and web pages. You will then delve into Power Query for data transformation, learning how to manipulate and clean your data. As you continue, you'll explore data modeling techniques, building relationships between different data sets, and mastering DAX functions for creating calculated columns and measures. The course also covers visualization techniques, including creating tables, charts, and maps, and how to format and customize your reports for maximum impact. Finally, you'll learn how to publish and share your reports via Power BI Service, including setting up dashboards and using row-level security. This course is perfect for individuals looking to enhance their data analysis skills and gain a strong foundation in Power BI. Whether you're a business analyst, data professional, or someone looking to upskill in data visualization, this course will take you through the essential concepts and tools in Power BI. By the end of the course, you will be able to connect Power BI to multiple data sources, transform data using Power Query, build complex data models and relationships, create detailed reports and dashboards, and publish them securely using Power BI Service.

GenAI for Data & Analytics
Generative AI is transforming modern data analytics, enabling organizations to move beyond traditional reporting toward faster, more accurate, and actionable business insights. This hands-on course, GenAI for Data & Analytics explores how leading AI tools for data analytics, including ChatGPT, Google Gemini, Python, and Google Colab, can be integrated into the CRISP-DM framework to enhance every stage of the analytics lifecycle - from business understanding and data preparation to predictive modeling, visualization, and stakeholder communication. Designed for data analysts, business analysts, BI developers, data scientists, and decision-makers, this AI for Data Analytics course demonstrates how large language models (LLMs) accelerate analytics workflows, improve productivity, and support responsible AI adoption while delivering measurable business outcomes. Through practical demonstrations, hands-on exercises, and real-world business scenarios, you will learn how to use AI for data analytics by applying prompt engineering, AI-assisted data analysis, Python for data analytics, and data storytelling to solve complex business problems and communicate insights effectively. You'll discover how using Generative AI for data analytics strengthens collaboration between technical and business teams, streamlines decision-making, and enables more efficient, data-driven strategies. By the end of the course, you'll be equipped to confidently use AI-powered analytics tools to transform data into meaningful insights, support business decisions, and create lasting organizational value.

R: Apply & Analyze K-Means Clustering for Unsupervised ML
Unlock the power of K-Means clustering and discover how to analyze unlabeled data using R programming. In this hands-on course, you will build a strong foundation in unsupervised machine learning by learning how to prepare data, apply clustering techniques, and interpret meaningful segmentation results. Designed for learners with a basic understanding of R and statistics, this course guides you through the complete clustering workflow using a real-world customer segmentation project. You will explore core clustering concepts, understand the goals of unsupervised learning, implement the K-Means algorithm in R, and examine how feature scaling influences cluster quality and performance. By the end of the course, you will be able to construct clustering workflows, evaluate clustering effectiveness, analyze segmentation outcomes, and recommend data-driven grouping strategies for real-world datasets. The project-based approach combines conceptual understanding with practical implementation, helping you develop confidence in applying K-Means clustering to customer segmentation and other unlabeled data problems. Whether you want to strengthen your data analysis skills or gain practical experience with clustering in R, this course provides a focused introduction to one of the most widely used unsupervised machine learning techniques.

Multimodal Agents with Vision Language Models
This course covers vision-language models and multi-agent coordination: how agents interpret images alongside text and divide work between them. Together they take an agent beyond single inputs. You explore how vision-language models such as CLIP, BLIP, and LLaVA align images with text, and use those embeddings to build a multimodal search system. You then construct a multimodal RAG pipeline that answers questions about charts and tables inside PDF documents, where text-only retrieval fails. The course closes with orchestration: planner, executor, and critic patterns that break complex tasks into steps, reliable tool schemas with error handling, and collaborative multi-agent systems where specialized agents pass context between each other. By the end of this course, you will be able to: - Explain how vision-language models align image and text representations. - Build a multimodal search system using shared embedding spaces. - Construct a multimodal RAG pipeline over documents containing charts. - Apply planner, executor, and critic patterns to decompose complex tasks. - Implement tool calling with reliable schemas and error handling. - Coordinate multiple agents through defined roles, handoffs, and shared context. Intended for learners who have completed Multimodal AI and Agent Fundamentals. Enroll now to give your agents sight, retrieval, and the ability to work as a team.

Master Time Series Forecasting with R: Analyze & Predict
Master the principles and practice of time series forecasting with R and build the skills to analyze historical data and generate reliable predictions. This course takes you through a structured learning journey, beginning with the fundamentals of forecasting in business analytics before progressing to regression, decomposition, and advanced forecasting models. You will learn how to distinguish between qualitative and quantitative forecasting methods, apply simple forecasting techniques, evaluate forecast accuracy, and address common forecasting challenges. As you advance, you will use simple, multiple, and non-linear regression, incorporate predictor and lagged variables, and decompose time series into trend, seasonal, cyclical, and irregular components to create more interpretable forecasting models. The course concludes with advanced techniques, including exponential smoothing, ARIMA, and Seasonal ARIMA (SARIMA), while using ACF and PACF diagnostics to support effective model selection and implementation in R. Designed for learners who want to strengthen their forecasting capabilities, this course combines foundational concepts with practical implementation in R through a logical, step-by-step progression. By the end of the course, you will be able to select appropriate forecasting methods, build and evaluate time series forecasting models, and develop accurate forecasting solutions that support data-driven decision-making across a wide range of business applications.

Foundations for Data Analytics Part 1
This course offers students an opportunity to learn fundamentals of computation required to understand and analyze real world data. The course helps students to work with modern data structures, apply data cleaning and data wrangling operations. The course covers conceptual and practical applications of probability and distribution, cluster analysis, text analysis and time series analysis. This course is Part 1 of 2.