Cursos de Datos e IA
Los mismos datos para todos, vengan de Udemy o de Coursera: precio, valoración, duración e idioma. 470 cursos encontrados. Afinar la búsqueda

GenAI for Talent Acquisition: Smarter Candidate Screening
In this course, you’ll discover how GenAI-powered tools can transform candidate screening by automating repetitive tasks, enhancing evaluations, and ensuring ethical hiring decisions. Through hands-on experience with custom GPTs, Gemini Gems, Power Automate, and AI-driven workflows, you’ll learn to optimize hiring processes, reduce bias, and improve decision-making. This course is designed for HR professionals, recruiters, talent acquisition specialists, and workforce strategists who want to leverage Generative AI for smarter, faster candidate screening. It’s also ideal for business analysts and operations managers seeking to optimize hiring workflows using AI-powered solutions. Whether you’re looking to automate resume parsing, enhance candidate assessments, or streamline your recruitment process, this course provides practical tools and strategies to elevate your talent acquisition game. To succeed in this course, you should have a basic understanding of HR processes, particularly in recruitment and candidate screening. Familiarity with Generative AI tools like ChatGPT, Google Gemini, or similar platforms will be beneficial, but no programming or technical expertise is required—just a willingness to explore AI-driven hiring solutions and experiment with automation tools. By the end of this course, you will have the skills and confidence to integrate Generative AI into your candidate screening processes, making recruitment smarter, faster, and more efficient. You’ll know how to craft AI-driven prompts, automate screening workflows, and mitigate bias, ensuring ethical and effective hiring decisions. Whether you’re looking to reduce manual workload, improve candidate evaluations, or enhance decision-making, you now have the tools to leverage AI responsibly and strategically in talent acquisition.

Developing AI Policy
AI tools are already changing how we work, and they will continue to do so for years. Over the next few years, we’re likely going to see AI used in ways we’ve never imagined and are not anticipating. This course will guide you as you lead your organization to adopt AI in a way that’s not unethical, illegal, or wrong. This course empowers you to make informed decisions and confidently create an AI policy that matches your organizational goals. Unique Features of this Course - Broadly applicable to audiences of any field - Efficient yet effective overview of major AI policy concerns - Beginner friendly for those who want to get started using generative AI tools - Practical tips for how to develop an AI policy and advisory team - Real-world examples of how industry regulations around AI have changed Key Words Artificial Intelligence (AI), Policy, Generative AI, Large Language Models (LLMs), Data Science Intended Audience - Professionals looking for an introduction to AI policies and general regulations - Decision makers who may have to help write AI policies or determine how AI will be used at an institute - Anyone curious about how we can use AI more responsibly
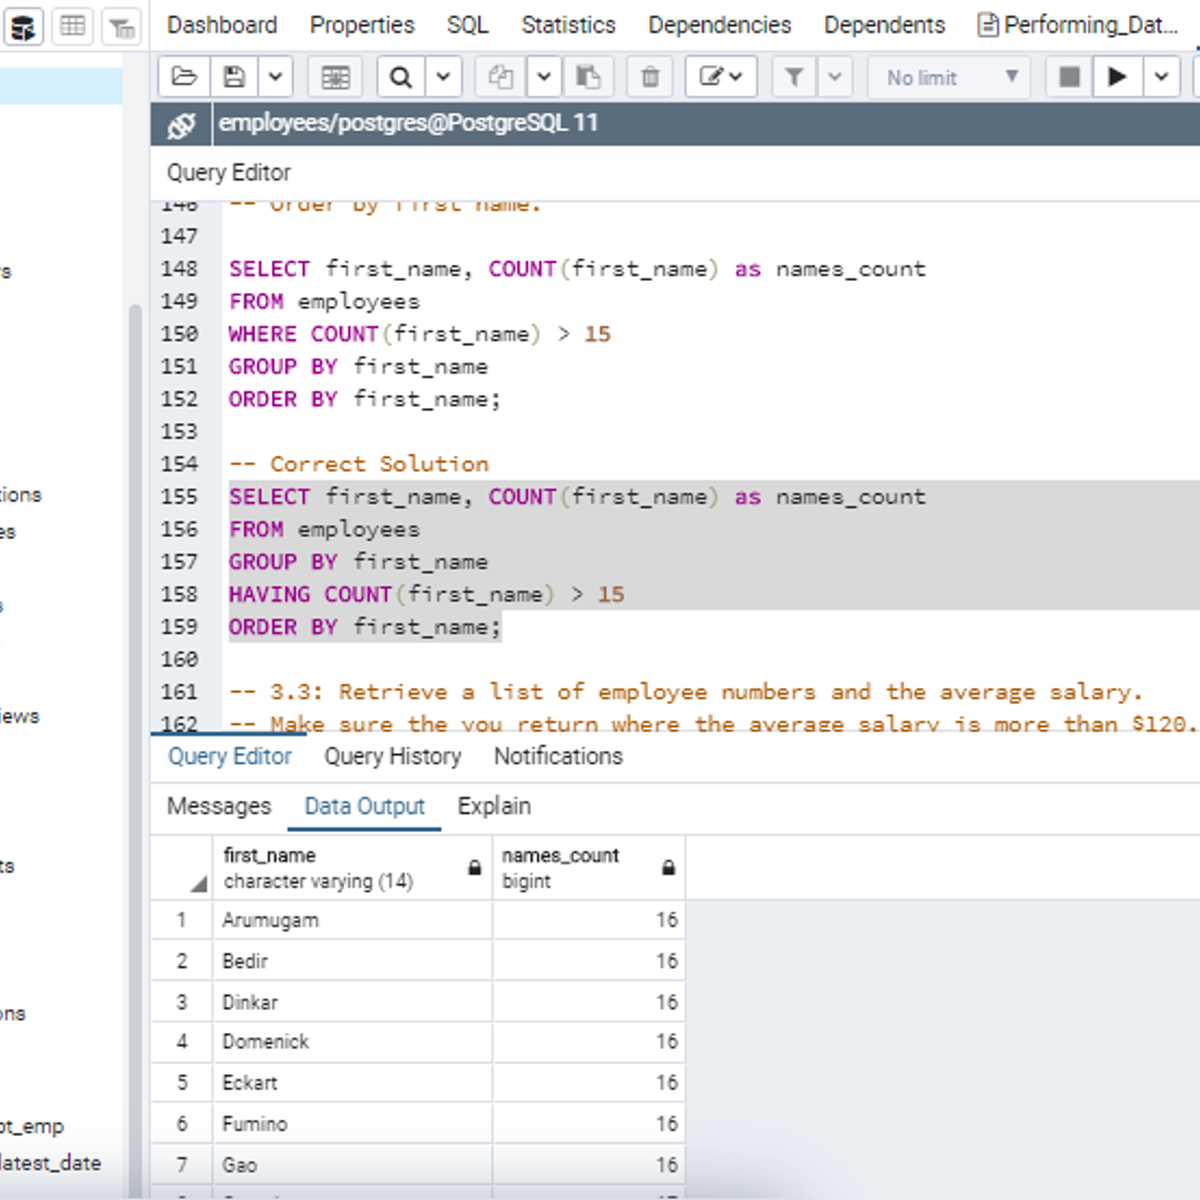
Performing Data Aggregation using SQL Aggregate Functions
In this 2-hour long project-based course, you will learn how to retrieve data from tables in a database using SQL SELECT statement with SQL Aggregate functions. The aggregate functions we will consider in this project are COUNT, SUM, MIN, MAX and AVG. Aggregate functions are used to summarize data from rows of a table into a single value. In addition, you will learn how to set conditions on the output of an aggregate function using the HAVING clause. Finally, you will learn how to tidy up the result set of aggregate functions using the ROUND function. Note: You do not need to be a data administrator or data analyst to be successful in this guided project, just a familiarity with querying databases using SQL SELECT statement suffice for this project. If you are not familiar with SQL and want to learn the basics, start with my previous guided projects titled “Performing Data definition and Manipulation in SQL." and “Querying Databases using SQL SELECT statement”

Star Schemas & Track Changes
Transform your data architecture skills with advanced dimensional modeling techniques that power enterprise-grade analytics systems. This course empowers data professionals to master the critical intersection of historical data tracking and dimensional model optimization. This Short Course was created to help data analysts accomplish sophisticated data warehouse design that maintains data integrity while maximizing query performance. By completing this course, you'll be able to implement robust historical tracking mechanisms and systematically optimize dimensional models for better business intelligence outcomes. By the end of this course, you will be able to: Apply Type-2 slowly changing dimension techniques to preserve complete data history Evaluate star schema structures and identify performance bottlenecks Propose specific refinements that improve both analytical capabilities and query efficiency This course is unique because it bridges the gap between theoretical dimensional modeling and practical implementation, providing hands-on experience with industry-standard tools like dbt and LookML that you'll use in real-world data engineering projects. To be successful in this project, you should have a background in SQL, basic data modeling concepts, and familiarity with data warehouse fundamentals. (It is possible)

Dealing With Missing Data
This course will cover the steps used in weighting sample surveys, including methods for adjusting for nonresponse and using data external to the survey for calibration. Among the techniques discussed are adjustments using estimated response propensities, poststratification, raking, and general regression estimation. Alternative techniques for imputing values for missing items will be discussed. For both weighting and imputation, the capabilities of different statistical software packages will be covered, including R®, Stata®, and SAS®.

SPSS: Apply & Interpret Logistic Regression Models
Build practical skills in logistic regression and supervised learning using IBM SPSS Statistics through a hands-on, application-focused learning experience. This course introduces the foundations of logistic regression while guiding you through the complete process of preparing data, configuring variables, building predictive models, and interpreting statistical outputs in SPSS. You will learn how to navigate the SPSS environment, apply logistic regression techniques, and analyze model results using structured datasets. Through guided case studies, including heart pulse analysis and smoking behavior classification, you will construct logistic regression equations, evaluate predictor significance, assess model performance, and interpret statistical evidence to support data-driven decisions. The course also reinforces key concepts with Excel-based logistic modeling. Designed for learners who want practical experience with predictive analytics in SPSS, this course combines conceptual understanding with step-by-step implementation. By the end of the course, you will be able to develop logistic regression models, interpret SPSS output tables, evaluate prediction accuracy, and confidently communicate analytical findings using statistical evidence.
Data Analysis with R
The R programming language is purpose-built for data analysis. R is the key that opens the door between the problems that you want to solve with data and the answers you need to meet your objectives. This course starts with a question and then walks you through the process of answering it through data. You will first learn important techniques for preparing (or wrangling) your data for analysis. You will then learn how to gain a better understanding of your data through exploratory data analysis, helping you to summarize your data and identify relevant relationships between variables that can lead to insights. Once your data is ready to analyze, you will learn how to develop your model and evaluate and tune its performance. By following this process, you can be sure that your data analysis performs to the standards that you have set, and you can have confidence in the results. You will build hands-on experience by playing the role of a data analyst who is analyzing airline departure and arrival data to predict flight delays. Using an Airline Reporting Carrier On-Time Performance Dataset, you will practice reading data files, preprocessing data, creating models, improving models, and evaluating them to ultimately choose the best model. Watch the videos, work through the labs, and add to your portfolio. Good luck! Note: The pre-requisite for this course is basic R programming skills. For example, ensure that you have completed a course like Introduction to R Programming for Data Science from IBM.
Data Processing with Excel
Data processing is essential in all research fields, and Excel is one of the most widely used general-purpose tools for data processing on personal computers. Through lectures and hands-on practice, this course introduces both fundamental and advanced Excel functions for data processing.

A Crash Course in Causality: Inferring Causal Effects from Observational Data
We have all heard the phrase “correlation does not equal causation.” What, then, does equal causation? This course aims to answer that question and more! Over a period of 5 weeks, you will learn how causal effects are defined, what assumptions about your data and models are necessary, and how to implement and interpret some popular statistical methods. Learners will have the opportunity to apply these methods to example data in R (free statistical software environment). At the end of the course, learners should be able to: 1. Define causal effects using potential outcomes 2. Describe the difference between association and causation 3. Express assumptions with causal graphs 4. Implement several types of causal inference methods (e.g. matching, instrumental variables, inverse probability of treatment weighting) 5. Identify which causal assumptions are necessary for each type of statistical method So join us.... and discover for yourself why modern statistical methods for estimating causal effects are indispensable in so many fields of study!
The Fundamental of Data-Driven Investment
In this course, the instructor will discuss the fundamental analysis of investment using R programming. The course will cover investment analysis topics, but at the same time, make you practice it using R programming. This course's focus is to train you to do the elemental analysis for investment management that you might need to do in your job every day. Additionally, the study note to do using Python programming will be provided. The course is designed with the assumption that most students already have a little bit of knowledge in financial economics. Students are expected to have heard about stocks and bonds and balance sheets, earnings, etc., and know the introductory statistics level, such as mean, median, distribution, regression, etc. The instructor will explain the detail of R programming for beginners. It will be an excellent course for you to improve your programming skills. If you are very good at R programming, it will provide you an excellent opportunity to practice again with finance and investment examples. Professor Youngju Nielsen creates the course with the assistants of Keonwoo Lim and Jeeun Yuen. =========================================================================================== Coursera Course recommendations before this course for those who are not familiar with basic R programming: <Getting Started with R> https://www.coursera.org/projects/getting-started-with-r <Introduction to Business Analytics with R> https://www.coursera.org/learn/business-analytics-r <Statistics with Python > https://www.coursera.org/specializations/statistics-with-python

Power BI for Data Science and Analytics
Welcome to Power BI for Data Science and Analytics. This course is designed to help you develop practical skills in data analytics using Power BI, a leading business intelligence platform. You will learn to use key Power BI features to extract and visualize insights from your data, making it easier to share findings and drive decisions. By the end of this course, you’ll be able to: - Use Power BI effectively for data analytics from connecting to data sources to building interactive reports and dashboards. - Create insightful visualizations that communicate important trends and patterns clearly to your team or stakeholders. - Apply AI features in Power BI such as natural language queries, anomaly detection, and cognitive services—to uncover deeper insights from your data. - Centralize and model data with dataflows, enabling reusable, efficient reporting for both text and image analytics. - Evaluate the impact of AI features on your analysis, so you can select the right tools for your projects. - Design scorecards to track KPIs and performance metrics in a format that’s easy to understand and act upon. This course is built for Data Analysts, Business Intelligence Developers, and Business Analysts looking to strengthen their analytical and reporting skills using Power BI. Some familiarity with MS Excel, Python, or Power BI is helpful, but not required, you willl gain hands-on experience with practical assignments and real-world scenarios. Join us on this journey to elevate your Power BI analytical skills and design capabilities.

Statistical Methods for Data Science
Welcome to the Ball State University course “Statistical Methods for Data Science.” As the title suggests, this course provides fundamental concepts and methods for data-generating mechanisms such as probability models and inferential methods such as estimation and hypothesis testing. scientists. You will need the right tools and analytics methods to make good sense of data and to make data-driven decisions. We are going to take a systematic approach to build a strong foundation on probability and probability models, large sample theory as a bridge between probability theory and inference, and basic inferential processes. Please note that as data scientists, it is important for us to be able to connect data and learn how the world around us works. To accomplish this challenging task, we will learn how we can connect data through probability theory and statistical models and take actionable decisions, confirm a hypothesis, or make predictions. After completing the course, you will be able to: 1) Apply probability and distribution theory to address real-world problems related to the data science field. 2) Classify the type of random variables and their probability distributions used to model various types of data in practice. 3) Outline the properties of discrete and continuous random variables. 4) Explain the sampling distributions of sample statistics such as the sample mean and the sample proportion. 5) Explain the Laws for Large numbers for the sample mean and the sample proportion. 6) Choose and use appropriate inference strategies, such as the right estimation method or the hypothesis test, to make inferences on unknown population parameters. 7) Illustrate the estimation process and hypothesis testing as a mode of statistical inference. 8) Outline multivariate discrete and continuous distributions to understand the joint behavior of several correlated discrete and continuous variables, respectively. 9) Relate multivariate analysis techniques to dimension reduction problems. 10) Utilize the R computational environment for probability simulation and other statistical computing in this course.

Visualize and Alert AI Performance KPIs
Visualize and Alert AI Performance KPIs is an intermediate course designed for data analysts, ML engineers, and product managers responsible for the operational health of AI systems. In the world of AI, a model's success is not just its accuracy—it is its cost, latency, and real-world impact. This course teaches you how to translate complex performance data into clear, actionable insights for any stakeholder. You will learn to move beyond cluttered dashboards by applying data storytelling principles to design effective visualizations, transforming confusing charts into compelling narratives that drive decisions. Through hands-on labs, you will master the art of creating proactive monitoring systems. You will learn to define critical KPIs, set precise, meaningful thresholds for cost and performance, and configure automated alert rules in business intelligence tools that notify your team of issues in real-time. By the end of this course, you will be able to build dashboards that empower leadership and create an automated defense that protects your AI systems from budget overruns and performance degradation.
파이썬의 데이터 과학 소개
이 과정에서는 학습자에게 람다, csv 파일 읽기 및 조작, numpy 라이브러리와 같은 기본적인 파이썬 프로그래밍 기술을 포함하여 파이썬 프로그래밍 환경의 기본 사항을 소개합니다. 이 과정에서는 인기 있는 python pandas 데이터 과학 라이브러리를 사용하여 데이터 조작 및 정리 기술을 소개하고 데이터 분석을 위한 중심 데이터 구조로 Series 및 DataFrame의 추상화를 소개하고 groupby, merge 및 pivot 테이블 같은 함수를 효과적으로 사용하는 방법에 대한 튜토리얼을 제공합니다. 이 과정이 끝나면 학생들은 표 형식의 데이터를 가져와 정리하고 조작하고 기본 추론 통계 분석을 실행할 수 있습니다. 이 과정은 다른 ‘파이썬을 사용한 응용 데이터 과학’ 과정보다 먼저 수강해야 합니다. 파이썬의 응용 플로팅, 차트 및 데이터 표현, 파이썬의 응용 머신 러닝, 파이썬의 응용 텍스트 마이닝, 파이썬의 응용 소셜 네트워크 분석.

Query Spatial with PostGIS
Querying spatial data effectively starts with understanding how geography is modeled, indexed, and analyzed inside a relational database. In this hands-on course, you’ll move beyond basic SQL by learning how to query geospatial data using PostGIS, PostgreSQL’s spatial extension. You’ll begin by working with core geometry types and spatial reference systems, building a foundation for how location data is stored and interpreted. From there, you’ll write spatial queries that perform distance calculations, proximity searches, and spatial joins to answer real-world questions. As you progress, you’ll explore spatial indexing and query patterns that improve performance and reliability as datasets grow. By the end of the course, you’ll produce reusable spatial SQL queries and analysis patterns that support practical use cases in areas such as logistics, urban planning, and geospatial data engineering—equipping you to work confidently with location-based data in production environments.

Transform, Analyze, and Optimize Your Data
Ready to unlock the true potential of your enterprise data infrastructure? This comprehensive course transforms you into a data optimization expert who can tackle the most challenging data engineering scenarios at scale. This Short Course was created to help data management and engineering professionals accomplish systematic data transformation, intelligent performance optimization, and strategic architecture migration decisions. By completing this course, you'll master the critical skills to convert massive volumes of semi-structured JSON data into queryable formats, analyze complex workload patterns to recommend optimal partitioning and clustering strategies, and conduct rigorous performance evaluations that guide million-dollar migration decisions. You'll emerge with the expertise to transform raw data chaos into streamlined, high-performance systems that power enterprise analytics. By the end of this course, you will be able to: Apply batch processing techniques to transform semi-structured JSON data into typed, queryable fields at enterprise scale Analyze workload patterns systematically to propose data partitioning and clustering keys that dramatically improve query performance Evaluate columnar and row-store processing performance comprehensively to recommend data-driven migration strategies This course is unique because it bridges the gap between theoretical database concepts and real-world enterprise implementation challenges, providing hands-on experience with the exact scenarios data engineers face when optimizing production systems. To be successful in this project, you should have experience with SQL, database concepts, and basic understanding of data architectures and performance monitoring tools.

SQL for Data Analytics
SQL is one of the most essential skills for working with data, enabling professionals to store, manage, transform, and analyze information efficiently. This course provides a comprehensive foundation in SQL for data analytics, covering the techniques and tools used to extract meaningful insights from structured and semi-structured data. Throughout the course, learners will develop practical SQL skills for creating and managing databases, importing and manipulating data, and building analytical queries. By working with topics such as aggregations, window functions, advanced data types, and statistical analysis, participants will gain the ability to solve real-world business and analytics challenges using SQL. What sets this course apart is its balanced approach to both database management and advanced analytical techniques. Learners move beyond basic querying to explore performance optimization, JSON and array processing, inferential statistics, and a complete analytics case study that demonstrates SQL in practice. This course is ideal for aspiring data analysts, business analysts, data professionals, and technical practitioners who work with data. A basic understanding of data concepts and familiarity with computers is recommended, though prior SQL experience is not required.

Analyze Data Using R for Statistical Analytics
Learners will analyze data using R, apply core statistical techniques, build analytical models, and interpret insights through visualization and real-world use cases. By the end of this course, learners will be able to confidently use R programming to perform data analysis, statistical modeling, and exploratory analytics. This beginner-friendly course provides a structured, end-to-end introduction to Data Analytics using R, starting from R’s origin, architecture, and syntax, and progressing through vectors, data frames, visualization, and statistical methods. Learners gain hands-on exposure to essential programming concepts, data handling techniques, and analytical workflows that are widely used in academia and industry. What makes this course unique is its subtitles-driven, concept-aligned curriculum, ensuring every topic directly reflects real instructional explanations rather than abstract theory. The course emphasizes practical analytics, including regression, decision trees, time series analysis, and business-focused case studies such as insurance analytics. Designed for aspiring data analysts, students, and professionals, this course builds a strong foundation in R programming while developing analytical thinking skills that are transferable to real-world data science and statistical problem-solving scenarios.

Generative AI Applications and Popular Tools
Welcome to the Generative AI Applications and Popular Tools course, your learning resource for actionable skills in chatbot technology including RASA, GPT-3, and OpenCV with an in-depth exploration of current Generative AI tools like MidJourney, GitHub Copilot, DALL·E, and more. Throughout this course, You will gain hands-on experience in building chatbots, using GPT-3 for advanced conversational AI, and developing image analysis projects with OpenCV. You will also discover how cutting-edge tools like MidJourney and DALL·E 2 transforms content creation, programming, and digital art. Ethical practices and real-world examples are included so you understand not just what these tools can achieve, but how to use them responsibly and effectively. Key outcomes include: - Build sophisticated chatbots with RASA and adapt them for real-life interaction scenarios. - Leverage GPT-3’s API to create dynamic conversational agents for various applications. - Apply OpenCV for practical image and video analysis tasks, including solutions for identification and detection. - Utilize popular tools like MidJourney, GitHub Copilot, DALL·E 2, Bard, and more, for next-level results in image generation, programming, and creative content automation. - Understand and apply ethical considerations for responsible use of Generative AI art and content technologies. This course is ideal for chatbot hobbyists, AI enthusiasts, developers, data scientists, and digital artists aiming to advance their real-world skills. The course content is approachable for beginners, while offering depth for experienced professionals. A basic understanding of programming and AI concepts is helpful, but not mandatory for success in this course. All learners are welcome, no matter your starting point, You will find clear pathways to apply these tools in your projects and career.

الحصول على البيانات وتنظيفها
قبل أن تتمكن من العمل مع البيانات، يجب أن تحصل على بعضها. ستتناول هذه الدورة التدريبية الطرق الأساسية التي يمكن من خلالها الحصول على البيانات. ستتناول الدورة التدريبية كيفية الحصول على بيانات من الويب ومن واجهات برمجة التطبيقات ومن قواعد البيانات ومن الزملاء بتنسيقات مختلفة. كما أنها ستتناول أساسيات تنظيف البيانات وكيفية جعل البيانات "مُرتبة". فالبيانات المرتبة تزيد من سرعة مهام تحليل البيانات النهائية. وكذلك، ستتناول الدورة مكونات مجموعة بيانات كاملة بما في ذلك البيانات الأولية وتعليمات المعالجة وكتب التعليمات البرمجية والبيانات التي تمت معالجتها. ستتناول الدورة التدريبية الأساسيات اللازمة لجمع البيانات وتنظيفها ومشاركتها.