Cursos de Datos e IA
Los mismos datos para todos, vengan de Udemy o de Coursera: precio, valoración, duración e idioma. 470 cursos encontrados. Afinar la búsqueda

Pandas with Python: Analyze, Transform & Export Data
Build practical data analysis skills with Python’s Pandas library. This course guides you from setting up Pandas in Jupyter Notebooks and working with Series and DataFrames to filtering, indexing, sorting, grouping, and transforming datasets. You’ll learn to convert data types, apply string methods, manage missing values and duplicates, optimize memory use, sample data, create dummy variables, and work confidently with date-time data. As you progress, you’ll configure display options, format outputs, merge and reshape data, interpolate time series, and use stacking, unstacking, pivot tables, and crosstabs. You’ll also export processed data to CSV and Excel for practical use. Designed for aspiring data analysts, Python enthusiasts, and professionals who want stronger data manipulation skills, the course combines structured lessons, quizzes, practical exercises, and applied projects. Its step-by-step progression from Pandas fundamentals to advanced data operations helps you practice with real-world datasets while improving efficiency and readability. Enroll to build confidence in preparing, analyzing, visualizing, and exporting data for data science and analytics work.

Apply SCD2 to Build Dynamic Data Models
Did you know that without historical data tracking, over 40% of business insights can become inaccurate or misleading? Implementing Slowly Changing Dimension (SCD) Type 2 ensures every change in your data tells the full story over time. This Short Course was created to help professionals in this field implement robust historical data tracking systems that maintain complete audit trails and support accurate trend analysis in enterprise data warehouses. By completing this course, you will be able to apply SCD Type 2 logic to build dynamic data models that capture historical changes, enabling reliable reporting, timebased analysis, and improved business intelligence accuracy. By the end of this 3hour long course, you will be able to: Apply slowlychanging dimension (SCD) Type 2 logic to build data models that track historical changes. This course is unique because it connects data modeling theory with practical warehouse implementation, giving you the skills to design scalable, auditready models that preserve data integrity across time. To be successful in this project, you should have: Basic SQL knowledge Understanding of data modeling concepts Familiarity with dbt fundamentals Data warehouse basics
Análisis de fútbol aplicado - Mirando a los casos reales
Este curso explora cómo se aplica la analítica del fútbol en entornos profesionales reales, pasando de la teoría a la práctica en el análisis del rendimiento, el scouting, la estrategia de club y los medios de comunicación. Los alumnos seguirán los flujos de trabajo utilizados por analistas de élite, desde la preparación previa al partido y la evaluación en directo hasta el informe posterior, y comprenderán cómo los clubes construyen procesos basados en datos para apoyar decisiones deportivas. A través de estudios de caso, el curso analiza cómo se diseñan bases de datos de scouting, cómo se construyen métricas clave y sistemas de clasificación, y cómo los clubes integran evaluaciones cualitativas con modelos avanzados como xG, xT, packing, clustering y sistemas de puntuación ponderada. Los alumnos también estudiarán cómo los clubes evalúan el rendimiento mediante Expected Points, simulaciones Monte Carlo, análisis por fases de juego, modelos de balón parado, planificación de plantilla, curvas de edad y evaluación contractual. Por último, el curso aborda cómo la analítica influye en los medios, desde gráficos radar hasta superposiciones en directo, y la psicología detrás de los datos, ayudando a identificar interpretaciones erróneas y construir argumentos más sólidos. Al finalizar, los alumnos comprenderán cómo la analítica apoya la táctica, el reclutamiento, la predicción y la narrativa en el ecosistema futbolístico.

Logistic Regression Fundamentals: Analyze & Predict
Gain a strong foundation in logistic regression and learn how to build, interpret, and evaluate predictive models for binary outcomes. This beginner-friendly course introduces the core principles of regression analysis before guiding you through the concepts and practical techniques that make logistic regression one of the most widely used methods in data science, predictive analytics, and business analytics. You will begin by exploring regression fundamentals, including dependent and independent variables, coefficients, and error terms. Next, you will compare probability prediction methods and understand why logistic regression is preferred over ordinary least squares (OLS) for binary classification problems. As you progress, you will analyze logit transformation, odds and probability interpretation, and Maximum Likelihood Estimation (MLE). You will also explore binning, continuous, and dummy variable approaches to improve model stability, apply SAS methodologies with PROC LOGISTIC, and evaluate models using concordant and discordant pairs, chi-square tests, and global versus local goodness-of-fit measures. Designed for beginners, aspiring data analysts, analytics professionals, and learners interested in predictive modeling, this course combines statistical foundations with practical model evaluation techniques to help you confidently analyze and assess logistic regression models for data-driven decision-making.

ChatGPT & Zapier: Agentic AI for Everyone
Agentic AI is a type of AI that combines Generative AI with tools and actions, allowing us to build "agents" to assist us with everyday tools like Gmail, Office365, Google Sheets, Salesforce, etc. These agents can perform tasks on our behalf, such as updating a spreadsheet or sending an email. There are classes that teach these Agentic AI concepts, but they are geared towards programmers. If you aren't a programmer, they won't teach you how to build agents to help with your daily tasks. This class will teach you how to use ChatGPT and Zapier to build your own agents to help prioritize tasks, keep track of expenses, plan meals and shopping lists, etc. These won't be tools that require you to cut and paste the results back into an email; these will be tools that can directly create a draft email and put it into your email account or allow you to snap a picture of a receipt on the go and have it show up in a spreadsheet. These agents can automate and take action for you. By the end of this class, not only will you understand state-of-the-art aspects of Agentic AI, but you will have built your own Travel Expense Agent. Your agent will be able to take a picture of a receipt or a description of an expense and catalog it into a Google Sheet. It will check your expense with another agent for completeness, ensure the expense isn't already in the spreadsheet, and even draft an email to your administrator with a simple reimbursement report. This course will transform the way you work.

Mastering Data Visualization with Matplotlib
Master the art of data visualization with Python's Matplotlib library by learning how to create, customize, and evaluate clear, professional-quality charts. This course guides you from the fundamentals of plotting through advanced visualization techniques, helping you build the skills needed to communicate data effectively. You will begin by configuring your Python environment, installing Matplotlib, and creating basic line plots while learning how to work with figures, axes, labels, scaling, and annotations. As you progress, you will explore advanced plotting techniques, including custom dashed lines, pseudocolor meshes, streamplots, ellipses, polar charts, pie charts, and logarithmic plots. You will also learn to customize figure styles, integrate image data, modify axes properties, and produce publication-ready visualizations with Matplotlib's styling tools. Designed for learners who want to strengthen their Python data visualization skills, this course provides a structured learning path from foundational concepts to advanced customization. By the end of the course, you will be able to create context-specific visualizations, select appropriate chart types, refine plot appearance, and develop polished visual outputs that support effective data storytelling using Matplotlib.

Causal Inference 2
This course offers a rigorous mathematical survey of advanced topics in causal inference at the Master’s level. Inferences about causation are of great importance in science, medicine, policy, and business. This course provides an introduction to the statistical literature on causal inference that has emerged in the last 35-40 years and that has revolutionized the way in which statisticians and applied researchers in many disciplines use data to make inferences about causal relationships. We will study advanced topics in causal inference, including mediation, principal stratification, longitudinal causal inference, regression discontinuity, interference, and fixed effects models.

Python para Ciencia de Datos
Resultados de aprendizaje: ● Comprender y analizar las herramientas básicas de Python. ● Utilizar herramientas de Python para el desarrollo de técnicas para el manejo y análisis de datos como apoyo a la toma de mejores decisiones, identificando las posibilidades y oportunidades en las organizaciones. ● Identificar las oportunidades y posibilidades que ofrece el uso de la Ciencia de Datos a las organizaciones. Las aplicaciones de técnicas de análisis de datos están siendo cada día más demandadas, debido a su utilización en las organizaciones y a la tendencia mundial de mejorar los procesos de toma de decisiones en base a la evidencia que se puede obtener del análisis de la enorme cantidad de información disponible. Así, la pertinencia del curso está relacionada con la necesaria aplicación de diversos métodos para analizar estos datos. Todo ello, para mejorar diferentes procesos de decisión de corto, mediano y largo plazo de los distintos sistemas dentro de una organización. Este curso busca que profesionales de diversas áreas y con distintas motivaciones logren comprender cómo el uso de adecuado y eficiente de Python como herramienta computacional para el análisis de datos puede mejorar su toma de decisiones dentro de su organización. Para ello se introducirán los conceptos básicos y generales del análisis de datos, se revisará la importancia de visualizar e identificar valor en los datos y cómo los distintos métodos descriptivos, predictivos, y prescriptivos permiten evidenciar oportunidades y justificar decisiones. Para ejemplificar estos conceptos y su desarrollo a través de Python, se verán casos prácticos en industrias como el retail, medicina y logística, entre otras.

NLP – Machine Learning Models in Python
Updated in May 2025. This course now features Coursera Coach! A smarter way to learn with interactive, real-time conversations that help you test your knowledge, challenge assumptions, and deepen your understanding as you progress through the course. Unlock the power of natural language processing (NLP) with machine learning techniques using Python in this hands-on, application-focused course. You'll gain practical skills in text classification, sentiment analysis, summarization, and topic modeling—all essential tools in the NLP toolkit. By the end of the course, you'll not only understand key algorithms but also be able to implement them confidently in Python. The course begins with setup instructions and success tips to ensure a smooth learning experience. You'll dive into spam detection using Naive Bayes, addressing real-world problems like class imbalance and model evaluation with ROC, AUC, and F1 Score metrics. With guided exercises and code demonstrations, you'll learn to build functional spam filters. Next, you'll explore sentiment analysis through logistic regression, mastering both binary and multiclass classification. Then, you’ll move into text summarization—starting with vector-based approaches and progressing to advanced techniques like TextRank. Both beginner and advanced methods are covered, ensuring an inclusive learning path. Finally, you'll delve into topic modeling and latent semantic analysis (LSA), implementing algorithms like LDA and NMF in Python. The course is ideal for aspiring data scientists, software engineers, and analysts with basic Python knowledge who want to specialize in NLP. The level is intermediate, and some prior experience in machine learning will help but it is not mandatory.

Analyze and Optimize Fusion Algorithms
Ready to master the art of algorithm efficiency? In today's multimodal AI landscape, fusion algorithms are the backbone of intelligent systems, but poorly optimized code can cripple performance and drain resources. This Short Course empowers ML engineers and AI professionals to systematically analyze computational complexity and memory footprints of fusion algorithms, enabling you to make strategic optimization decisions that dramatically improve system performance. By the end of this course, you will be able to decompose fusion algorithms into fundamental operations, calculate time and space complexity using Big O notation, and propose targeted optimizations like sparse-attention alternatives that can reduce memory usage by 30% or more. This course is unique because it bridges theoretical complexity analysis with hands-on profiling tools like cProfile, giving you immediately applicable skills for real-world optimization challenges. To be successful, you should have experience with machine learning algorithms and basic understanding of computational complexity concepts.

Spatial Analysis, 3D Data & Machine Learning
Advance your skills in spatial analysis and machine learning for geospatial data. This course covers geostatistics, LiDAR and 3D data processing, and supervised machine learning techniques. You will also learn how to apply deep learning methods for imagery analysis. By the end of the course, you will be able to build and evaluate models for geospatial data and analyze complex spatial patterns.
BI Reporting and Dashboard Fundamentals
Build practical reporting and dashboard skills that help you turn data into clear, useful business communication. In this course, you’ll develop hands-on experience creating reports and dashboards used in roles such as data analyst, business analyst, reporting analyst, operations analyst, and business intelligence analyst. As you move through the course, you’ll practice building tables and visualizations, selecting appropriate chart types, applying visual design principles, and using BI tools to assemble dashboards based on business requirements. This is a non-traditional, skill-based learning experience organized around real workplace tasks instead of a fixed lecture sequence. It’s designed to reflect responsibilities you may see in job descriptions, from creating standard business reports and KPI dashboards to presenting data clearly for stakeholders. You can personalize your path based on what you already know, focus on the skills you need most, and skip content when it’s not necessary. The course curates high-quality lessons from expert instructors, selecting the strongest content for each skill so you can build practical, career-relevant reporting and dashboard experience. By the end, you’ll be able to create basic data visualizations and tables, build standard chart types in business intelligence tools, and assemble reports and dashboards that are clear, effective, and aligned to defined specifications. This course is a strong fit if you already have basic experience working with data, spreadsheets, or introductory reporting tools.

Projeto final de Data Analytics do Google: conclua um estudo de caso
Este é o oitavo curso do Certificado de Data Analytics do Google. Você terá a oportunidade de completar um estudo de caso opcional, que ajudará você a se preparar para a busca de emprego em Data Analytics. Os estudos de caso normalmente são usados pelos empregadores para avaliar as habilidades analíticas. Para o seu estudo de caso, escolha um cenário baseado em análises. Depois, faça perguntas, prepare, processe, analise, visualize e aja de acordo com os dados desse cenário. Você também aprenderá outras habilidades úteis para os processos seletivos por meio de vídeos com perguntas e respostas comuns nas entrevistas, materiais úteis para criar um portfólio online e muito mais. Os analistas de dados do Google vão instruir e oferecer maneiras práticas de realizar tarefas comuns de analistas de dados com as melhores ferramentas e recursos. Os alunos que concluírem este programa de certificação poderão se candidatar a empregos de nível inicial para analista de dados. Nenhuma experiência anterior é necessária. Ao final deste curso, você poderá: - Conhecer os benefícios e os usos de estudos de caso e portfólios ao procurar um trabalho. - Explorar situações reais de entrevistas de trabalho e perguntas comuns nas entrevistas. - Descobrir como os estudos de caso podem fazer parte do processo seletivo. - Examinar e considerar diferentes cenários de estudo de caso. - Criar seu próprio estudo de caso para seu portfólio.

AI in Manufacturing: Predictive Maintenance and Alerts
This hands-on, project-based course teaches you how to predict machine failures before they happen by combining machine learning with real-time, no-code automation. You'll move from the business case for predictive maintenance — the crippling cost of unplanned downtime and why reactive maintenance is broken — through the sensor data and failure signatures that make prediction possible, and into a plain-English primer on the ML models behind it all, with no heavy maths required. In two guided hands-on sessions, you'll build and train a Random Forest failure-detection model in Google Colab on the AI4I 2020 dataset, then wire it into a live n8n workflow that simulates sensor data, calls your model's API, routes decisions with an IF node, and fires real email alerts the moment a failure is predicted. You'll finish by exploring real deployment challenges — sensor drift, alert fatigue, and ERP/CMMS integration — and preview where to go next, from binary "will it fail?" detection to RUL regression that answers "when will it fail?". The course spans 3 hours total: 100 minutes of theory, 60 minutes of hands-on building, and a 20-minute wrap-up.This hands-on, project-based course teaches you how to predict machine failures before they happen by combining machine learning with real-time, no-code automation. You'll move from the business case for predictive maintenance — the crippling cost of unplanned downtime and why reactive maintenance is broken — through the sensor data and failure signatures that make prediction possible, and into a plain-English primer on the ML models behind it all, with no heavy maths required. In two guided hands-on sessions, you'll build and train a Random Forest failure-detection model in Google Colab on the AI4I 2020 dataset, then wire it into a live n8n workflow that simulates sensor data, calls your model's API, routes decisions with an IF node, and fires real email alerts the moment a failure is predicted. You'll finish by exploring real deployment challenges — sensor drift, alert fatigue, and ERP/CMMS integration — and preview where to go next, from binary "will it fail?" detection to RUL regression that answers "when will it fail?". The course spans 3 hours total: 100 minutes of theory, 60 minutes of hands-on building, and a 20-minute wrap-up. Independent Course Disclaimer Disclaimer: This is an independent educational resource created by Board Infinity for informational and educational purposes only. This course is not affiliated with, endorsed by, sponsored by, or officially associated with any company, organization, or certification body unless explicitly stated. The content provided is based on industry knowledge and best practices but does not constitute official training material for any specific employer or certification program. All company names, trademarks, service marks, and logos referenced are the property of their respective owners and are used solely for educational identification and comparison purposes.

PySpark & Python: Hands-On Guide to Data Processing
Build a strong foundation in PySpark and Python for distributed data processing with this beginner-friendly, hands-on course. You will explore how distributed computing supports modern data analysis while developing the Python programming skills needed to create PySpark applications. Starting with Python syntax, control flow, and functional programming concepts, you will learn to work with Resilient Distributed Datasets (RDDs), apply core Spark transformations and actions, and build scalable data processing workflows. As you progress, you will perform DataFrame transformations, execute join operations, integrate MySQL data using JDBC, and construct a Word Count pipeline to reinforce distributed processing techniques. Designed for beginners interested in big data, data processing, and PySpark, this course combines practical coding exercises with clear explanations to help you understand both the concepts and their real-world application. Throughout the course, you will practice analyzing, debugging, and evaluating PySpark programs while gaining experience with distributed data workflows. By the end of the course, you will be able to build and analyze PySpark applications, process distributed datasets efficiently, integrate external data sources, and apply essential data engineering concepts that prepare you for more advanced big data analytics.

Foundations for Data Analytics Part 2
This course offers students an opportunity to learn fundamentals of computation required to understand and analyze real world data. The course helps students to work with modern data structures, apply data cleaning and data wrangling operations. The course covers conceptual and practical applications of probability and distribution, cluster analysis, text analysis and time series analysis. This is Part 2 of 2.

Bayesian Statistics: Mixture Models
Bayesian Statistics: Mixture Models introduces you to an important class of statistical models. The course is organized in five modules, each of which contains lecture videos, short quizzes, background reading, discussion prompts, and one or more peer-reviewed assignments. Statistics is best learned by doing it, not just watching a video, so the course is structured to help you learn through application. Some exercises require the use of R, a freely-available statistical software package. A brief tutorial is provided, but we encourage you to take advantage of the many other resources online for learning R if you are interested. This is an intermediate-level course, and it was designed to be the third in UC Santa Cruz's series on Bayesian statistics, after Herbie Lee's "Bayesian Statistics: From Concept to Data Analysis" and Matthew Heiner's "Bayesian Statistics: Techniques and Models." To succeed in the course, you should have some knowledge of and comfort with calculus-based probability, principles of maximum-likelihood estimation, and Bayesian estimation.

Responsible AI - Principles and Ethical Considerations
Welcome to "Responsible AI – Principles and Ethical Considerations"! Dive deep into the very essence of Responsible AI with us. Uncover the significance of key principles shaping technology's future. From ethical considerations to fairness, transparency, and accountability, we discuss these principles with real-world examples, putting them into the context of data science. This course is designed for a diverse group of learners, including adult learners seeking to expand their knowledge, AI policy makers shaping the technological landscape, and leaders in the technology space specially navigating AI's strategic integration. This course also is helpful for AI Policy Makers, AI thought leaders, and anyone who are curious to harness AI's potential, rooted in distinct professional roles and aspirations. Learn techniques to spot, tackle, and mitigate bias in AI algorithms, fostering fairness and inclusivity in AI systems. Discover the pivotal role of accountability in AI and its impact on ethical governance, privacy, and security throughout development and deployment. Striking the right balance between accuracy and explainability, you'll grasp the art of crafting an accountable and trustworthy AI system whose decisions can be easily interpreted. By the course end, you'll not just understand the need for responsible AI but adeptly explain its principles and construct a solid framework for developing AI responsibly. This course doesn't just prepare you for a job; it empowers you with the knowledge to apply responsible AI principles ethically and develop AI systems responsibly. To be successful in this course, understanding of the Basics of AI and Generative AI technologies and platforms, or knowledge of the nuances of social impact. Knowledge about the various legal and ethical frameworks would be an added advantage. Join us in shaping the future responsibly!
Relational Database Support for Data Warehouses
Relational Database Support for Data Warehouses is the third course in the Data Warehousing for Business Intelligence specialization. In this course, you'll use analytical elements of SQL for answering business intelligence questions. You'll learn features of relational database management systems for managing summary data commonly used in business intelligence reporting. Because of the importance and difficulty of managing implementations of data warehouses, we'll also delve into storage architectures, scalable parallel processing, data governance, and big data impacts. In the assignments in this course, you can use either Oracle or PostgreSQL.
¿Cómo hemos llegado hasta aquí?El desarrollo de la analítica
Este curso explora cómo el fútbol pasó de tomar decisiones basadas en la intuición a convertirse en un deporte impulsado por los datos. Los alumnos descubrirán los orígenes de la analítica deportiva a través de la revolución “Moneyball” en el béisbol, el auge de los modelos de calidad de tiro en el baloncesto y el hockey, y los pioneros que aplicaron por primera vez el pensamiento científico al fútbol. Desde los apuntes manuales de Charles Reep hasta el modelo cibernético de Lobanovskyi, el curso traza cómo las ideas de la estadística, la ingeniería y la informática transformaron gradualmente el juego. Con el avance tecnológico, el análisis de vídeo, los datos de eventos y los sistemas de tracking revolucionaron la evaluación del rendimiento, la captación de talento y el diseño táctico. Estudios de caso muestran cómo los clubes modernos utilizan datos para explotar ineficiencias del mercado y obtener ventajas competitivas. Al finalizar el curso, los alumnos comprenderán los hitos, las personas y las tecnologías que impulsaron la revolución analítica del fútbol y prepararon el camino para los modelos avanzados actuales.

From Data to Decisions: Getting Started with AI
This course is intended for individuals who'd like to work with data from their organization but don't know where to start. We'll combine generative AI and your insights to structure research questions, understand the variables in your dataset, and begin describing the data for the purpose of generating insights into better decisions. After taking this course, learners will know how to identify the outcomes and predictors in a dataset and how to summarize different types of variables in a dataset using generative AI.

Data science perspectives on pandemic management
The COVID-19 pandemic is one of the first world-wide scenarios where data made a difference in capturing and analyzing the diffusion and impact of the disease. We offer an introductory course for decision makers, policy makers, public bodies, NGOs, and private organizations about methods, tools, and experiences on the use of data for managing current and future pandemic scenarios. This course describes modern methods for data-driven policy making in the context of pandemics. Discussed methods include policy making, innovation, and technology governance; data collection from citizens, crowdsourcing, gamification, and game with a purpose (GWAP); crowd monitoring and sensing; mobility and traffic analysis; disinformation and fake news impacts; and economical and financial impacts and sustainability models. Methods, tools, and analyses are presented to demonstrate how data can help in designing better solutions to pandemics and world-wide critical events. In this course you will discover the role of policy making and technology governance for managing pandemics. You will learn about methods like crowdsourcing, gamification, sensing of crowds and built environments, and contact tracing for understanding the dynamics of the pandemic. You will understand the risk of disinformation and its impact on people perception and decisions. The course also covers the financial models that describe the pandemic monetary impact on individuals and organizations, as well as the financial sustainability models that can be defined. Thanks to this course you will get a deeper understanding of motivations, perceptions, choices, and actions of individuals in a pandemic setting, and you will be able to start defining appropriate mitigation actions. This course was developed by a set of European research and education institutions as part of the research project 'Pan-European Response to the Impacts of the COVID-19 and future Pandemics and Epidemics' (PERISCOPE, https://www.periscopeproject.eu/). Funded by the European Commission Research Funding programme Horizon 2020 under the Grant Agreement number 101016233, PERISCOPE investigates the broad socio-economic and behavioural impacts of the COVID-19 pandemic, to make Europe more resilient and prepared for future large-scale risks.
Data Mining Pipeline
This course introduces the key steps involved in the data mining pipeline, including data understanding, data preprocessing, data warehousing, data modeling, interpretation and evaluation, and real-world applications. This course can be taken for academic credit as part of CU Boulder’s MS in Data Science or MS in Computer Science degrees offered on the Coursera platform. These fully accredited graduate degrees offer targeted courses, short 8-week sessions, and pay-as-you-go tuition. Admission is based on performance in three preliminary courses, not academic history. CU degrees on Coursera are ideal for recent graduates or working professionals. Learn more: MS in Data Science: https://www.coursera.org/degrees/master-of-science-data-science-boulder MS in Computer Science: https://coursera.org/degrees/ms-computer-science-boulder Course logo image courtesy of Francesco Ungaro, available here on Unsplash: https://unsplash.com/photos/C89G61oKDDA
Intro to TensorFlow en Español
Este curso se enfoca en aprovechar la flexibilidad y facilidad de uso de TensorFlow 2.x y Keras para compilar, entrenar e implementar modelos de aprendizaje automático. Aprenderá sobre la jerarquía de la API de TensorFlow 2.x y conocerá los componentes principales de TensorFlow mediante ejercicios prácticos. Le mostraremos cómo trabajar con conjuntos de datos y columnas de atributos. Aprenderá a diseñar y compilar una canalización de datos de entrada de TensorFlow 2.x. Adquirirá experiencia práctica en la carga de arreglos de NumPy, imágenes y datos de texto con tf.data.Dataset, así como de datos de CSV con Pandas. También adquirirá experiencia práctica en la creación de columnas de atributos numéricas, categóricas, agrupadas en depósitos y con hash. Además, le presentaremos las API secuencial y funcional de Keras para mostrarle cómo crear modelos de aprendizaje profundo. Hablaremos sobre las funciones de activación, pérdida y optimización. Nuestros labs prácticos sobre los notebooks de Jupyter le permitirán compilar modelos de aprendizaje automático de regresión lineal básica, y de regresión logística básica y avanzada. Aprenderá a entrenar, implementar y llevar a producción modelos de aprendizaje automático a gran escala con AI Platform de Cloud.

Data Science Foundations with No-Code Tools
Build the confidence to tackle any data project with zero coding. This course introduces modern no-code platforms, guiding learners in acquiring, cleaning, and visualizing data from diverse sources. Master the principles of robust data science practice, from data integrity checks to exploratory analysis. By the end, learners will know how to design models mapped directly to solving pressing business problems, all within easy-to-use tools that bridge technical and non-technical roles. Each module builds job-ready skills for regional and global data needs, with applications relevant to India, the USA, and Spanish-speaking markets.
Foundations of AI Native Data Engineering
This course introduces the foundational shift from traditional data engineering to AI-native data engineering. Learners reframe data platforms and pipelines as intelligent, production-grade assets that power analytics, machine learning, generative AI systems, semantic search, RAG workflows, and AI-powered assistants. This course explains how AI workloads consume data differently, introduces embeddings and vector retrieval as core primitives, demystifies LLMs as technical systems, and helps learners connect familiar data engineering skills to modern AI data lifecycles and AI-native architectures. The updated Course 1 design also emphasizes that production AI-native systems require ownership boundaries and collaboration across data engineering, ML/AI engineering, application engineering, platform engineering, security/governance, and product teams. By the end of the course, learners understand how modern AI systems are built end to end, how data engineering enables them, and how to redesign legacy pipelines to support semantic search, RAG, and AI-powered workflows.
Evaluate and Create ML Workflows Visually
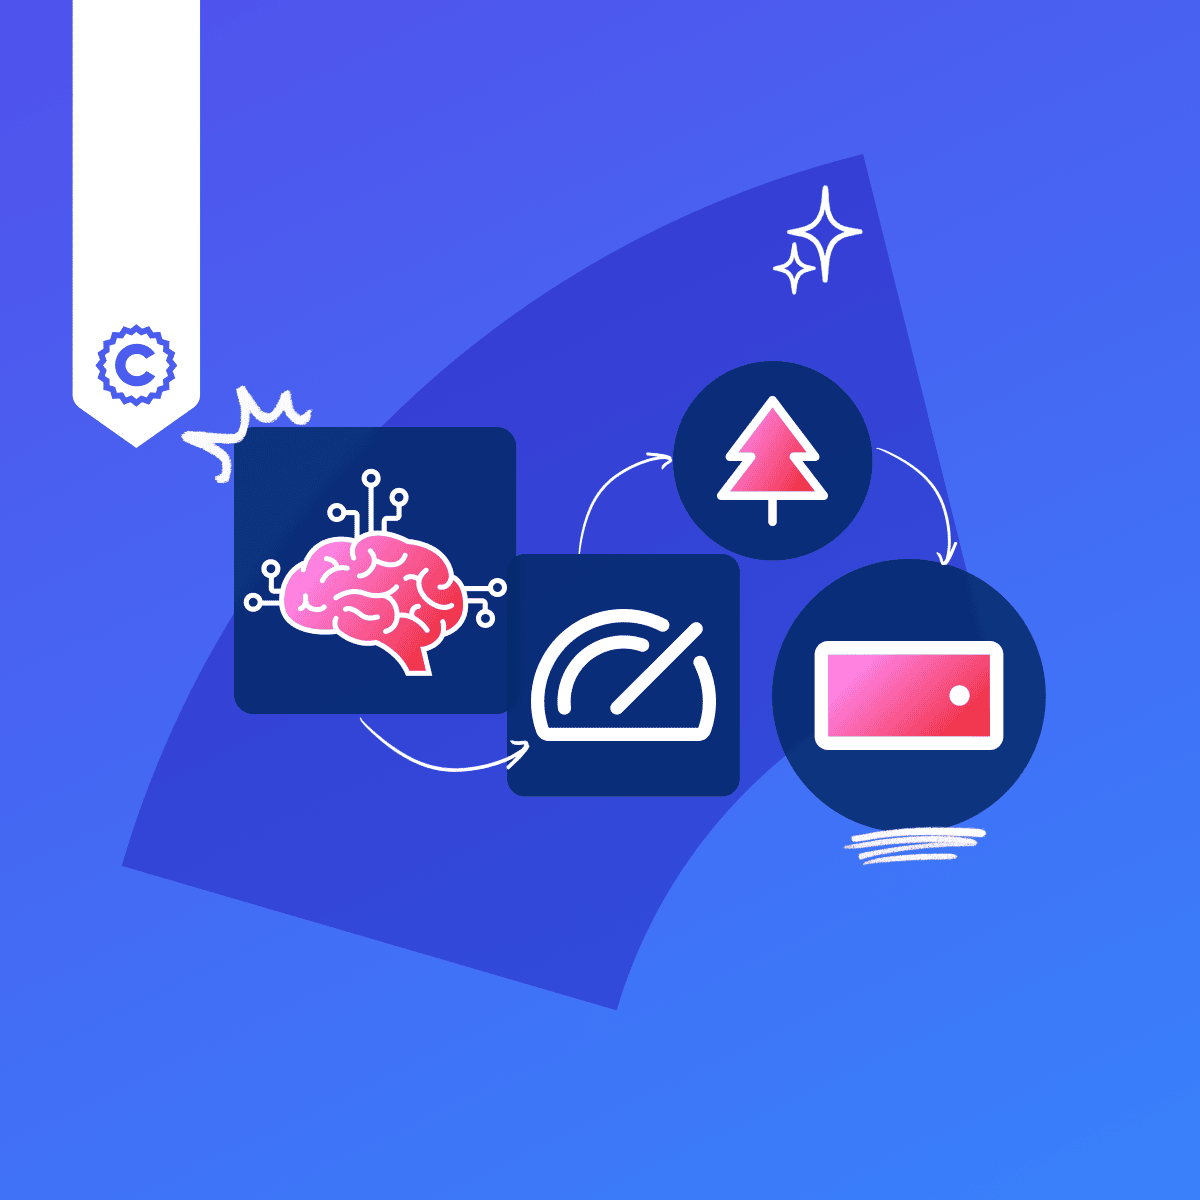
This course teaches you how to evaluate machine learning experiments visually and how to transform prototype scripts into reusable, maintainable workflows. You’ll start by exploring how to use visual dashboards like TensorBoard to compare model variants using metrics such as accuracy curves, loss trajectories, and compute usage. Then, you’ll learn how to refactor model training code into standardized structures using tools like LightningModules and DataModules. Through short videos, readings, hands-on Learnings and a final assessment, you’ll gain confidence in comparing models, understanding experiment performance, and creating workflows that your entire team can use. Whether you're presenting model trade-offs or preparing code for a shared repository, you’ll walk away ready to support real-world ML development with clarity and rigor.

Prediction and Control with Function Approximation
In this course, you will learn how to solve problems with large, high-dimensional, and potentially infinite state spaces. You will see that estimating value functions can be cast as a supervised learning problem---function approximation---allowing you to build agents that carefully balance generalization and discrimination in order to maximize reward. We will begin this journey by investigating how our policy evaluation or prediction methods like Monte Carlo and TD can be extended to the function approximation setting. You will learn about feature construction techniques for RL, and representation learning via neural networks and backprop. We conclude this course with a deep-dive into policy gradient methods; a way to learn policies directly without learning a value function. In this course you will solve two continuous-state control tasks and investigate the benefits of policy gradient methods in a continuous-action environment. Prerequisites: This course strongly builds on the fundamentals of Courses 1 and 2, and learners should have completed these before starting this course. Learners should also be comfortable with probabilities & expectations, basic linear algebra, basic calculus, Python 3.0 (at least 1 year), and implementing algorithms from pseudocode. By the end of this course, you will be able to: -Understand how to use supervised learning approaches to approximate value functions -Understand objectives for prediction (value estimation) under function approximation -Implement TD with function approximation (state aggregation), on an environment with an infinite state space (continuous state space) -Understand fixed basis and neural network approaches to feature construction -Implement TD with neural network function approximation in a continuous state environment -Understand new difficulties in exploration when moving to function approximation -Contrast discounted problem formulations for control versus an average reward problem formulation -Implement expected Sarsa and Q-learning with function approximation on a continuous state control task -Understand objectives for directly estimating policies (policy gradient objectives) -Implement a policy gradient method (called Actor-Critic) on a discrete state environment

Python Data Analytics
This course introduces the use of the Python programming language to manipulate datasets as an alternative to spreadsheets. You will follow the OSEMN framework of data analysis to pull, clean, manipulate, and interpret data all while learning foundational programming principles and basic Python functions. You will be introduced to the Python library, Pandas, and how you can use it to obtain, scrub, explore, and visualize data. By the end of this course you will be able to: • Use Python to construct loops and basic data structures • Sort, query, and structure data in Pandas, the Python library • Create data visualizations with Python libraries • Model and interpret data using Python This course is designed for people who want to learn the basics of using Python to sort and structure data for data analysis. You don't need marketing or data analysis experience, but should have basic internet navigation skills and be eager to participate.

Attention Mechanisms and Transformer Models Course
This deep learning course provides a comprehensive introduction to attention mechanisms and transformer models the foundation of modern GenAI systems. Begin by exploring the shift from traditional neural networks to attention-based architectures. Understand how additive, multiplicative, and self-attention improve model accuracy in NLP and vision tasks. Dive into the mechanics of self-attention and how it powers models like GPT and BERT. Progress to mastering multi-head attention and transformer components, and explore their role in advanced text and image generation. Gain real-world insights through demos featuring GPT, DALL·E, LLaMa, and BERT. To be successful in this course, you should have a basic understanding of neural networks, machine learning concepts, and Python programming. By the end of this course, you’ll be able to: - Explain how attention mechanisms enhance deep learning models - Implement and apply self-attention and multi-head attention - Understand transformer architecture and real-world use cases - Analyze leading GenAI models across NLP and image generation Ideal for AI developers, ML engineers, and data scientists.

Automate, Debug, and Customize SQL Databases
Ready to take your SQL skills beyond basic queries? This course transforms intermediate SQL developers into advanced database engineers who can automate deployments, debug complex issues, and build reusable solutions. This Short Course was created to help data management and engineering professionals accomplish enterprise-level database automation and customization. By completing this course, you'll master CI/CD database deployment pipelines, systematic error handling with TRY-CATCH blocks, and custom function development. You'll apply these skills to real scenarios like Flyway migrations, production debugging workflows, and Python UDF creation in Snowflake. This course is unique because it bridges the gap between traditional SQL development and modern DevOps practices, giving you the practical skills to build robust, maintainable database systems. To be successful in this project, you should have a background in intermediate SQL, database development experience, and familiarity with version control systems."

R 프로그래밍을 사용한 데이터 분석
Google 데이터 애널리틱스 수료증 과정의 일곱 번째 강좌입니다. 이 강좌에서는 데이터 애널리스트 직무에 필요한 입문 수준의 스킬을 배우게 됩니다. 여기에서는 R이라는 프로그래밍 언어와 R 언어로 작업할 수 있는 환경인 RStudio 사용 방법을 살펴봅니다. 또한 R 패키지와 같은 R 고유의 소프트웨어 애플리케이션 및 도구에 관해서도 배웁니다. R을 통해 데이터를 더욱 새롭고 강력한 방식으로 정리, 구성, 분석, 시각화, 보고할 수 있다는 사실을 확인하게 될 것입니다. 현직 Google 데이터 애널리스트가 최고의 도구와 리소스를 사용하여 일반적인 데이터 분석 작업을 완료하는 실습을 제시하고 지도합니다. 이 수료증 과정을 완료한 수강생은 데이터 애널리스트로서 입문 수준의 직무에 지원할 역량을 갖추게 됩니다. 관련 경험은 필요하지 않습니다. 이 강좌의 목표는 다음과 같습니다. - R 프로그래밍 언어 사용의 이점을 살펴봅니다. - RStudio를 사용하여 분석에 R을 적용하는 방법을 알아봅니다. - R 프로그래밍과 관련된 기본 개념을 살펴봅니다. - Tidyverse 패키지를 포함한 R 패키지의 내용과 구성요소를 살펴봅니다. - 데이터 프레임과 R에서의 데이터 프레임 사용에 관해 이해합니다. - R에서의 시각화 생성 옵션을 알아봅니다. - R 프로그래밍을 문서화하기 위한 R Markdown에 관해 배웁니다.

GenAI for Performance Management
This course explores how Generative AI (GenAI) can enhance goal setting, performance monitoring, feedback, and development planning, making the process more efficient and personalized. By leveraging AI performance management tools for automation, coaching, and generating actionable insights, managers and employees can focus on meaningful employee growth and alignment with organizational goals. Through real-world examples, practical scenarios, and interactive exercises, this course enables participants to use GenAI to transform performance management and drive productivity and engagement across industries. This course is designed for employees, managers, supervisors, and team leaders at all levels interested in applying GenAI to improve the effectiveness and efficiency of performance management processes. It is also intended for HR, performance management, and organizational development professionals who want to integrate artificial intelligence in performance management to refine and optimize their practices. Participants should have a basic understanding of the performance management cycle, including key concepts such as SMART objectives, KPIs, feedback, and development plans. Familiarity with AI concepts and algorithms, along with an understanding of prompt engineering, will help learners engage more effectively with the course content and apply GenAI techniques to real-world scenarios. By the end of this course, learners will be able to explain core performance management concepts alongside the benefits and practical applications of GenAI. They will learn to use GenAI for setting SMART goals, selecting KPIs, and aligning team objectives with organizational goals. Participants will also develop skills in using AI for performance evaluations, identifying trends, and delivering real-time feedback. Finally, they will be equipped to design performance reviews that foster engagement, growth, and personalized development.

Machine Learning with PySpark
Machine Learning with PySpark introduces the power of distributed computing for machine learning, equipping learners with the skills to build scalable machine learning models. Through hands-on projects, you will learn how to use PySpark for data processing, model building, and evaluating machine learning algorithms. By the end of this course, you will be able to: - Understand the fundamentals of PySpark and its architecture - Load, process, and manipulate large-scale datasets using PySpark’s DataFrame and RDD APIs Build machine learning models with PySpark’s MLlib, covering classification, regression, and clustering techniques - Optimize and tune machine learning models for better performance - Apply techniques for feature engineering, model evaluation, and hyperparameter tuning in a distributed environment Who Should take this Course: This course is ideal for data professionals, aspiring data engineers, and machine learning enthusiasts who want to use PySpark to handle large-scale data and build machine learning models. Prerequisites: Some prior knowledge of Python and machine learning concepts is recommended. Join us to enhance your data processing and machine learning skills with PySpark and take your expertise to the next level!
Analyze and Automate Pivot Table Problem Solutions
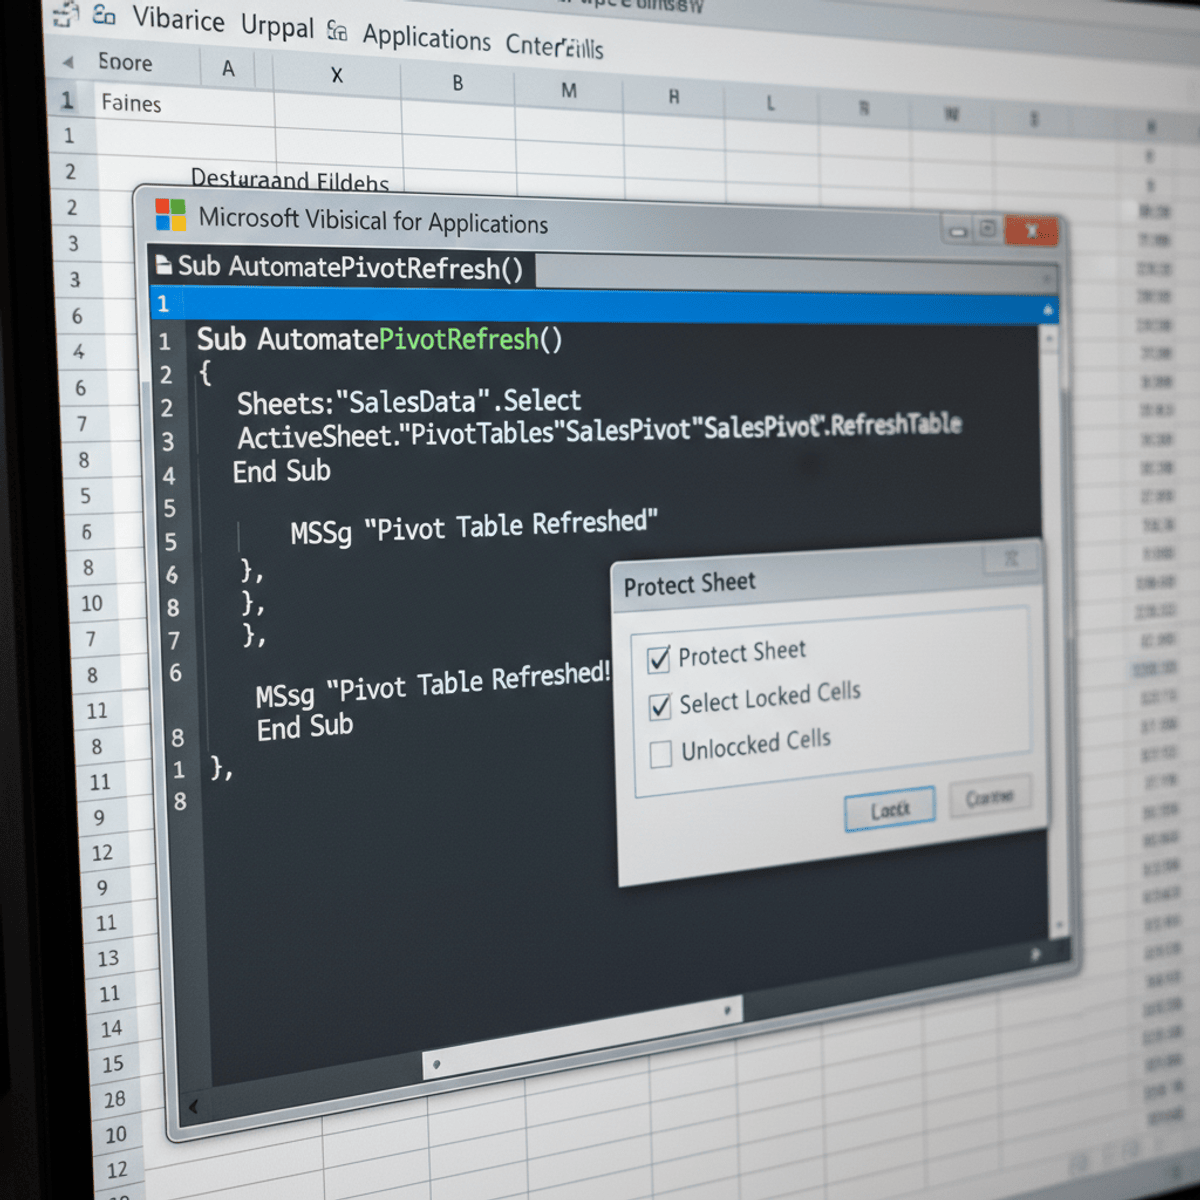
By completing this course, learners will be able to analyze Pivot Table data issues, evaluate visualization and layout problems, apply automation techniques using macros, and implement protection strategies to deliver reliable, scalable Excel reports. Learners will develop the ability to diagnose grouping errors, resolve chart overlaps, standardize time-based data, and prevent structural issues that commonly disrupt Pivot Table reporting workflows. This course benefits professionals who work with Excel reports by equipping them with practical, problem-focused skills that go beyond basic Pivot Table creation. Instead of only demonstrating features, the course emphasizes real-world troubleshooting, enabling learners to confidently handle complex reporting challenges and reduce manual rework. Automation lessons introduce repeatable solutions using macros, helping learners save time and ensure consistency across reports, while protection techniques safeguard critical structures from accidental changes. What makes this course unique is its project-driven approach to Pivot Table problem handling and automation. Learners gain hands-on exposure to real issues encountered in business reporting environments, combined with actionable solutions, automation strategies, and documentation practices. This combination ensures learners can design robust, user-safe Pivot Table solutions that scale effectively in professional settings.
Production Machine Learning Systems
In this course, we dive into the components and best practices of building high-performing ML systems in production environments. We cover some of the most common considerations behind building these systems, e.g. static training, dynamic training, static inference, dynamic inference, distributed TensorFlow, and TPUs. This course is devoted to exploring the characteristics that make for a good ML system beyond its ability to make good predictions.

Analyze Fraud Using Data Analytics and R
Learners will analyze fraud patterns, evaluate fraud detection techniques, and apply data-driven analytical approaches to identify and mitigate fraudulent activities. This course builds a strong foundation in fraud concepts while progressively introducing modern fraud analytics methods, including Big Data approaches and machine learning techniques such as supervised and unsupervised learning. Learners will gain a structured understanding of the fraud lifecycle, high-level fraud analytics strategies, and the measurable business benefits of analytics-driven fraud prevention. By completing this course, learners will be able to interpret real-world fraud scenarios, assess risk using analytical reasoning, and support informed decision-making in fraud detection environments. The course emphasizes practical insight through detailed credit card fraud examples, enabling learners to connect theory with real operational challenges. What makes this course unique is its end-to-end perspective on fraud analytics—from foundational concepts to strategic implementation—combined with a project-oriented approach using R for analytical thinking. Rather than focusing solely on tools, the course develops analytical judgment, pattern recognition skills, and strategic awareness essential for roles in fraud risk, data analytics, and financial crime prevention.

Advanced Prompt Engineering for Everyone
Unlock the full potential of generative AI and become a master of prompt engineering. Dive deeper into how you can use In-context Learning to build better and more reliable prompts. See how Retrieval Augmented Generation (RAG) works and what can go wrong that you can counteract with fact-checkable prompt formats. Overcome your struggles in getting the right output from generative AI models with template-based output formats to achieve precision in your interactions with AI models. Tap into powerful AI capabilities for tasks ranging from social media comment analysis to survey results interpretation and beyond. This course will empower you with the skills needed to build exceptional prompts, using simple techniques, such as preference-driven refinement, and become and expert in leveraging generative AI for productivity and creativity. What You Will Learn: In-Context Learning: Understand how to provide context within prompts to guide AI models towards more accurate and relevant outputs. Learn techniques to embed contextual information that enhances the model’s understanding and performance. Retrieval Augmented Generation (RAG): Explore how to integrate retrieval systems with generative models to provide more precise and informed responses. This module covers the mechanisms to combine the strengths of both retrieval and generation. Template Pattern and Examples: Master the art of crafting template-based prompts to achieve consistent and desired outputs. Learn how to tell generative AI to fit its output into your format and overcome struggles with getting exactly what you want. Tapping Into AI Capabilities for Everyday Use: Delve into practical applications such as analyzing social media comments, interpreting survey results, and other everyday tasks where generative AI can make a significant impact. Gain hands-on experience with real-world examples. Building Great Prompts: Discover simple methods for constructing effective prompts. Learn how preference-driven refinement can elevate your prompt engineering skills, ensuring that outputs meet your exact needs and preferences.

Introduction to Tableau
The Introduction to Tableau course will give you an understanding of the value of data visualizations. You will learn how to preprocess data and how to combine data from multiple tables found within the same data source as well as other data sources in Tableau Public. You will have developed the skills to leverage data visualization as a powerful tool for making informed decisions. This course is for anyone who is curious about entry-level roles that demand fundamental Tableau skills, such as business intelligence analyst or data reporting analyst roles. It is recommended (but not required) that you have some experience with Tableau Public, but even if you're new to Tableau Public, you can still be successful in this program. By the end of the course, you will be able to: -Describe the value of data visualizations in the field of business analytics. -Preprocess data in Tableau Public. -Combine data from multiple tables found within the same data source as well as other data sources in Tableau Public.

Machine Learning with Small Data Part 1
This course addresses the challenge of machine learning (ML) in the context of small datasets, a significant issue due to ML's increasing data demands. Despite ML's success in various fields, many areas can't provide large labeled datasets because of costs, privacy, or security laws. As big data becomes standard, efficiently learning from smaller datasets is crucial. This course, ideal for graduate students with some ML experience, focuses on modern deep learning techniques for small data applications relevant in healthcare, military, and various industry sectors. Prerequisites include ML familiarity and Python proficiency. Deep learning experience is not necessary but beneficial.
Sourcing Analytics
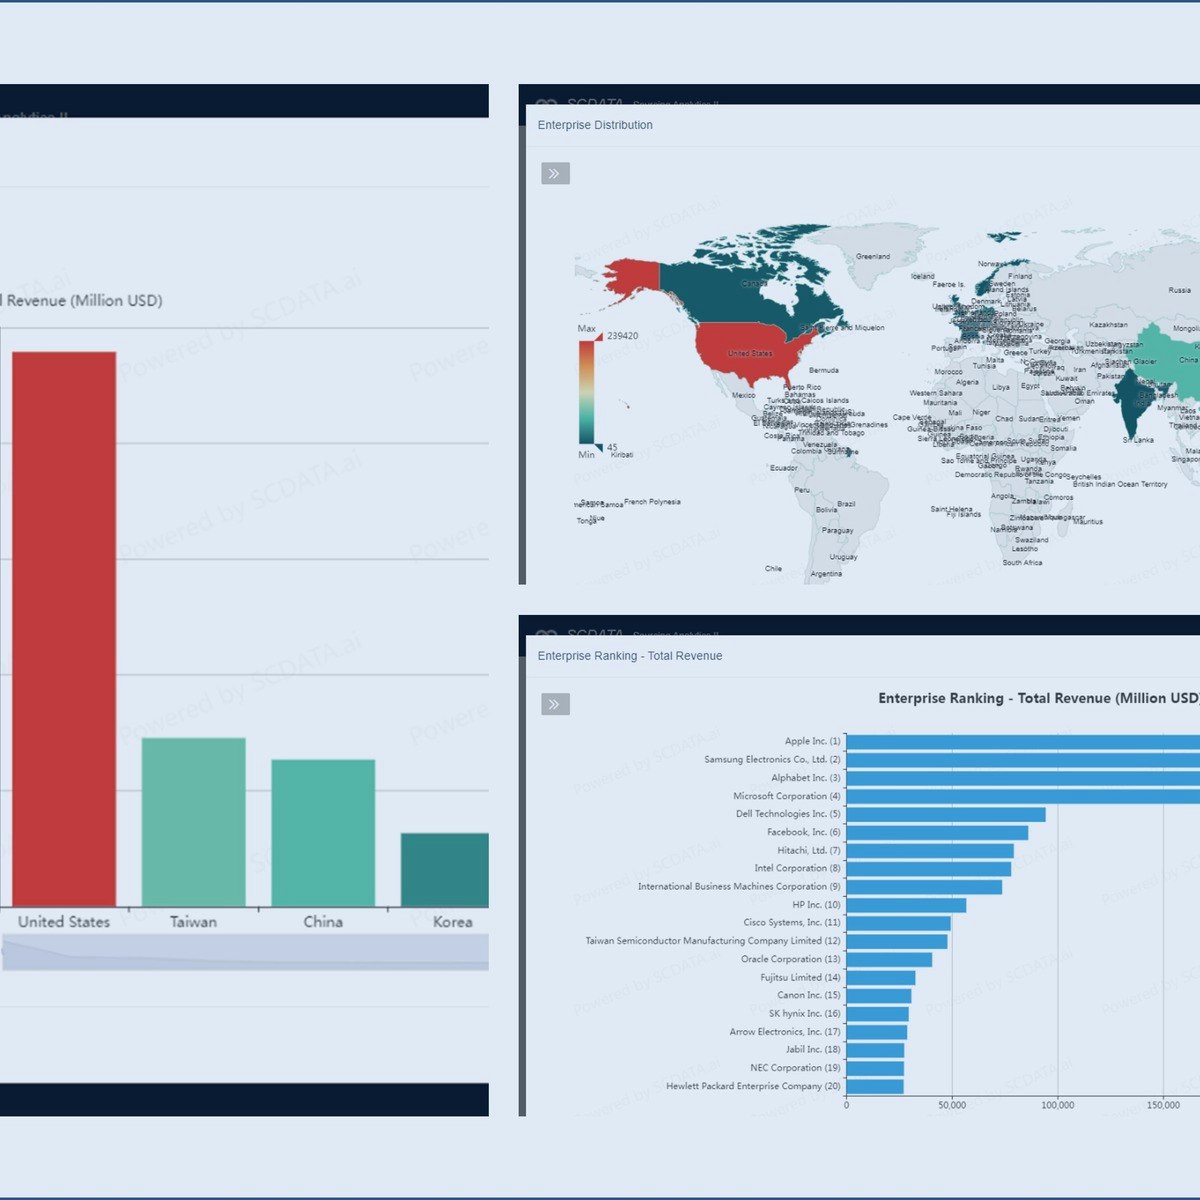
It is easy to spend money, but hard to get the value. Apple could not achieve the financial success of iPhone without its global sourcing strategy. However, Samsung Electronics, one of Apple’s key suppliers, became a competitor. Meanwhile, many new suppliers are emerging globally. To continue the success, Apple must identify and select new suppliers that are capable, inexpensive and financially robust. The question is, how to do it right for this year? What Apple experienced is typical in practice, as sourcing poses huge risks despite its significant benefits. In this world of global trade restructuring, companies are making frequent adjustments to their supply bases by evaluating and selecting suppliers constantly. In this course, you will learn sourcing analytics which applies data analytics to supplier development and management. Specifically, you will learn supplier intelligence, bargaining power analysis, and supplier benchmarking, to identify, evaluate and select the best suppliers meeting your company's needs.

Getting Started with SAS Visual Analytics
In this course, you learn more about SAS Visual Analytics and the SAS Viya platform, how to access and investigate data in SAS Visual Analytics, and how to prepare data for analysis using SAS Data Studio.
LangGraph Framework
LangGraph Framework is an intermediate-level course designed for developers and AI engineers who want to build production-ready, stateful AI systems that go beyond simple prompt-response interactions. In today's AI landscape, the most powerful applications aren't single agents working in isolation—they're coordinated systems that maintain context, make intelligent decisions, and collaborate to solve complex problems. This course teaches you to harness LangGraph's graph-based architecture to create AI workflows with persistent memory, conditional logic, and multi-agent coordination. Through hands-on labs, real-world case studies from companies like Klarna, CyberArk, and Replit, and practical projects, you'll learn to build systems that maintain context across interactions, handle failures gracefully, and coordinate multiple specialized agents to create emergent intelligence. Whether you're building customer service automation, research assistants, or complex business workflows, this course equips you with the skills to create AI systems that are not just intelligent, but reliable, maintainable, and production-ready.
Building Generative AI-Powered Applications with Python
Ready for an interactive learning experience to build real-world generative AI applications and chatbots? In this hands-on course, you’ll develop a series of guided projects using Python, Flask, Gradio, and LangChain to create AI-powered applications for practical scenarios, including a voice assistant, a meeting summarizer, a language translator, and a personalized career coach. You’ll work with popular large language models (LLMs) such as GPT-3, Llama 2, and Flan-UL2, hosted on platforms like IBM watsonx and Hugging Face. You’ll also explore advanced concepts, such as retrieval-augmented generation (RAG), to enhance LLM responses with external knowledge, and integrate speech-to-text (STT) and text-to-speech (TTS) using IBM Watson® Speech Libraries and OpenAI Whisper to enable voice interactions. While a basic understanding of Python is essential, knowledge of HTML, CSS, or JavaScript is helpful but not required. The course includes supporting readings and videos to build foundational knowledge of the models and frameworks used. In addition, a comprehensive course glossary will help reinforce your learning.

Online Influence and Persuasion
In the "Online Influence and Persuasion" course, learners will explore the intricate dynamics of social media through the lens of Social Network Analysis (SNA). This course is designed to equip you with essential skills to analyze how social media influences behaviors, perceptions, and organizational structures. By mastering key SNA measures and clustering techniques, you will uncover valuable insights into network subgroups and social forces. What sets this course apart is its comprehensive approach to understanding online influence, including the neurobiological aspects of social media addiction and the interplay between misinformation and persuasion. You will gain hands-on experience managing social media data through APIs, enabling you to extract, transform, and analyze data effectively. By the end of this course, you will not only understand the theoretical foundations of online influence and persuasion but also acquire practical skills that can be applied in various contexts, from marketing to behavioral research. This unique combination of theory and practice will prepare you to navigate the complexities of the digital landscape and make data-driven decisions that can enhance organizational effectiveness.
Working with BigQuery
In this guided project, you will learn about working with Google's BigQuery which is allows easily work with and query massive datasets without worrying about time wasting or having the right infrastructure to analyze that data quickly. You will learn how to use big query to collect your data, query it with SQL and even do quick visualizations on it.
Pair Programming with a Large Language Model
AI pair programming is being rapidly adopted by developers to help with tasks across the tech stack, from catching bugs to quickly inserting entire code snippets. Learn how LLMs can enhance, debug, and document your code in this new course built in collaboration with Google. Get free access to Google’s PaLM API and get hands-on experience that you can apply to your own projects. You’ll learn how to use an LLM in pair programming to: 1. Simplify and improve your code 2. Write test cases 3. Debug and refactor your code 4. Explain and document any complex code written in any coding language

Covid-19 Death Medical Analysis & Visualization using Plotly
In this 2-hour long project-based course, you will learn how to build bar graphs, scatter plots, Choropleth maps and Wordcloud to analyze and visualize the global scenario of Covid-19 and perform medical analysis to various conditions that contribute to death due to Covid-19. We will be using two separate datasets for this guided project. The first dataset has been taken from worldometer and the second one has been made available by the Centers for Disease Control and Prevention (CDC), United States. We will be using Python as our Programming language and Google Colab as our notebook. It is required for you to have a Gmail Account for this project. It is recommended to have some experience in the Python programming language but even if you do not have any prior experience in Python programming or medical science, you will be able to complete this project. This project is beginner-friendly. We will visualize the current global scenario of Covid-19 using bar graphs and scatter plots followed by geographical data visualization using Choropleth maps. Then we will dive into medical analysis. We will then visualize how Covid deaths vary with respect to age group and how various pre-existing medical conditions vary with age. Then we will visualize and analyze how various medical conditions contribute to Covid death. We will also compare the performance of all the 50 states in the US against Covid. In the final task, we will finish by creating WordCloud text visualization of various medical conditions and condition groups that contribute to Covid deaths. Note: This course works best for learners who are based in the North America region. We’re currently working on providing the same experience in other regions.

Mastering Oracle SQL Functions with SQL Developer
Master advanced Oracle SQL techniques to analyze, optimize, and transform data for real-world business reporting and decision-making. In this course, you will build practical skills in Oracle SQL Developer by applying advanced SQL operators, designing efficient queries with views and indexes, and using conditional and analytic functions to solve complex data challenges. You will begin by restructuring and summarizing datasets with CUBE, ROLLUP, GROUPING SETS, and UNPIVOT while improving query performance through views and indexes. As you progress, you will create logic-driven queries using CASE and DECODE, manage NULL values with NVL, NVL2, and COALESCE, and generate deeper business insights with analytic functions such as ROW_NUMBER, RANK, DENSE_RANK, and NTILE. Designed for learners seeking to strengthen their Oracle SQL skills for data analysis, business intelligence, and database management, this course emphasizes hands-on, case-study-driven practice rather than theory alone. By the end of the course, you will be able to optimize SQL queries, evaluate query performance, analyze multidimensional data, and build flexible, business-ready reporting solutions using advanced Oracle SQL techniques.

Desktop GIS & Spatial Databases
Learn how to work with desktop GIS tools and spatial databases to manage and analyze geospatial data. This course introduces QGIS for map creation and visualization, PyQGIS for automating workflows, and PostGIS for querying and managing spatial data. You will learn how to style layers, perform spatial operations, and run spatial SQL queries to extract insights. By the end of this course, you will be able to integrate GIS tools with databases to handle real-world geospatial tasks efficiently.